


The State of the Postal Service
The U.S. Postal Service is the only delivery service that reaches every address in the nation: Nearly 167 million residences, businesses and Post Office Boxes. The Postal Service generally receives no tax dollars for operating expenses and relies on the sale of postage, products and services to fund its operations.
This page gives a brief overview of the current state of the USPS operations in the areas that matter to you most.
SERVICE
Service performance is a measurement of the speed and reliability of mail services. The Postal Service measures mail from collection to delivery to report on its own performance. Service performance is the speed and reliability with which a postal service meets its established delivery standards. The Postal Service measures on-time delivery of mail from collection to delivery to report on its performance.
MAIL VOLUME
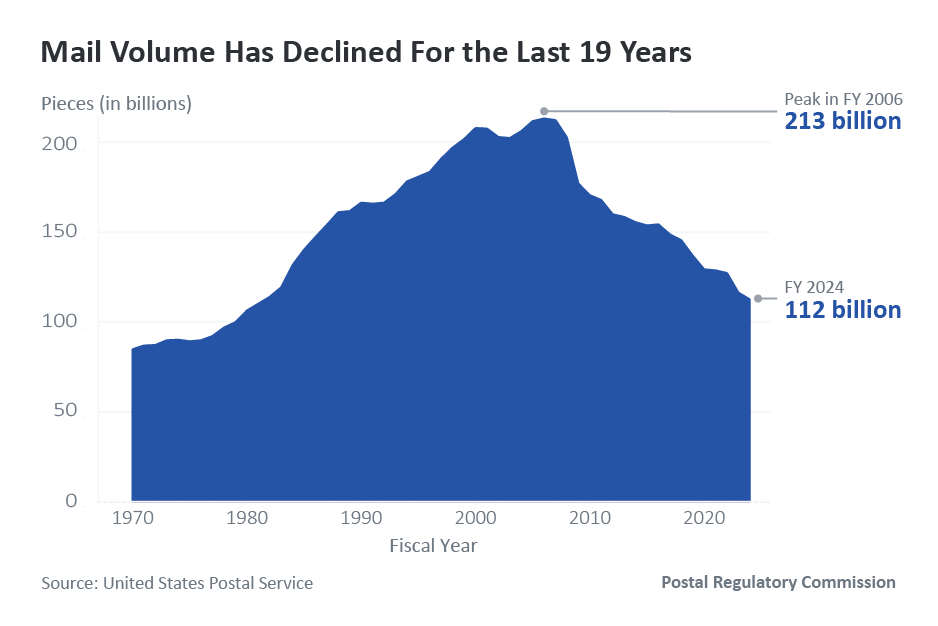
In FY 2006, the Postal Service delivered a total of 213 billion pieces of mail. That was its peak. Since then, mail volume has drastically declined.
The Postal Service is self-funded, relying on the sale of its products and services. Revenue is largely generated through the sale of Market Dominant products and package delivery. When mail volume decreases, it directly impacts the Postal Service's ability to generate sufficient revenue to cover its costs.
This chart displays the Postal Service's total mail volume. In FY 2025, the Postal Service delivered 109 billion pieces of mail, a loss of 104 billion pieces, or nearly 50 percent, from FY 2006's peak of 213 billion.
Data source (1970-2025): USPS Periodic Report
Data source (2025): USPS Form 10-K FY 2025
Further Insight
SERVICE PERFORMANCE
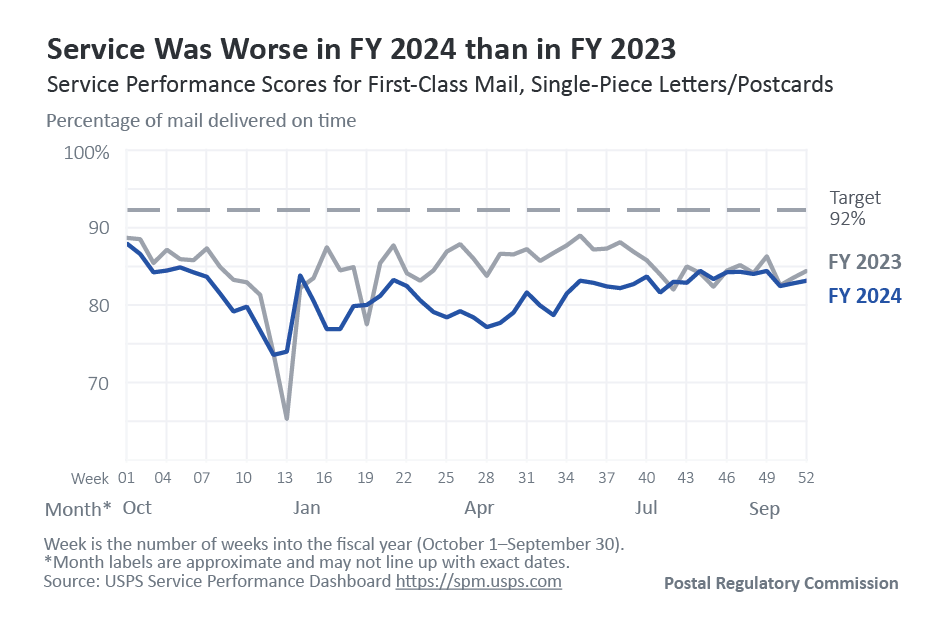
This chart illustrates on-time delivery performance of First-Class Mail, Single-Piece Letters/Postcards in FY 2025 compared to the years prior. Overall, in FY 2025, the Postal Service's on-time performance for Single-Piece Letters/Postcards was approximately 3 percentage points below the Postal Service's on-time performance in FY 2024.
Each year, the Commission must make a written determination as to whether the Postal Service achieved the stated performance target for meeting the established service standards. Here, a “standard” is the number of days the Postal Service has determined it will take a specific type of mail to be delivered.
The Commission compares the percentage of mail pieces that achieve the service standard against the Postal Service's self-established targets.
Effective April 1 and July 1, 2025, the Postal Service implemented a two-phase service standard change. Phase 1 introduced distance-based adjustments with a mix of shorter and longer standards for some mail, and Phase 2 reduced the applicable service standard for some mail.
Data source: USPS Service Performance Dashboard
Further Insight
FINANCIAL
The Postal Service is generally funded by ratepayers (customers who pay for its services), rather than taxpayers. Congress did, however, authorize taxpayer-funded support for the Postal Service in the Postal Service Reform Act of 2022. In general, the Postal Service relies on the sale of postage, products, and services to fund operations. The Postal Service continues to face long-term systemic challenges to its business model.
NET INCOME
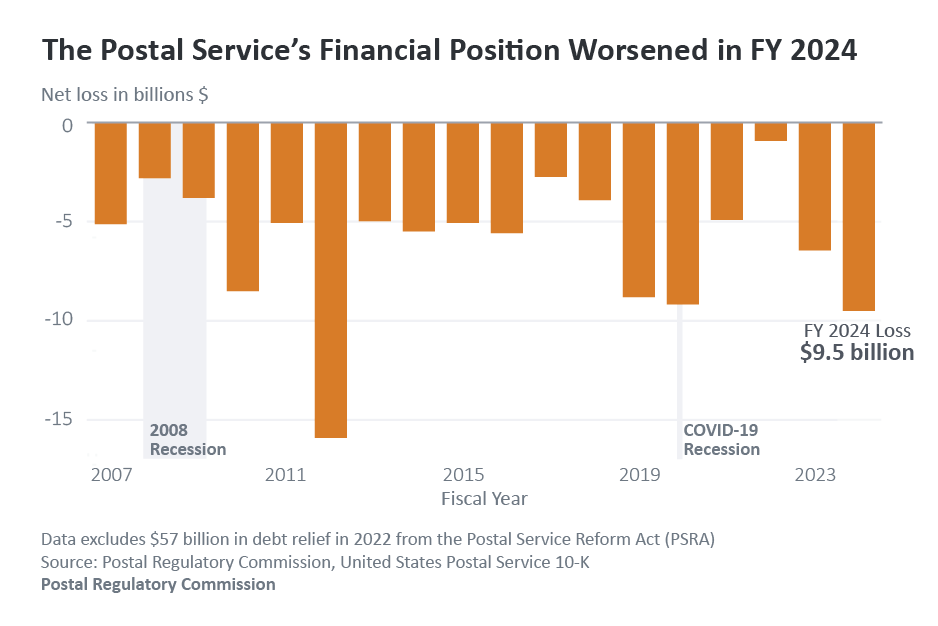
The Postal Service's financial position continued to worsened in Fiscal Year 2025 compared to Fiscal Year 2024. Overall, the Postal Service has not covered its costs since 2006, when mail volume was at its peak. At the end of 2025, the Postal Service reported a $9 billion net loss for the fiscal year.
Data source (2007-2024): PRC Financial Report
Data source (2025): USPS Form 10-K FY 2025
Further Insight
RATES
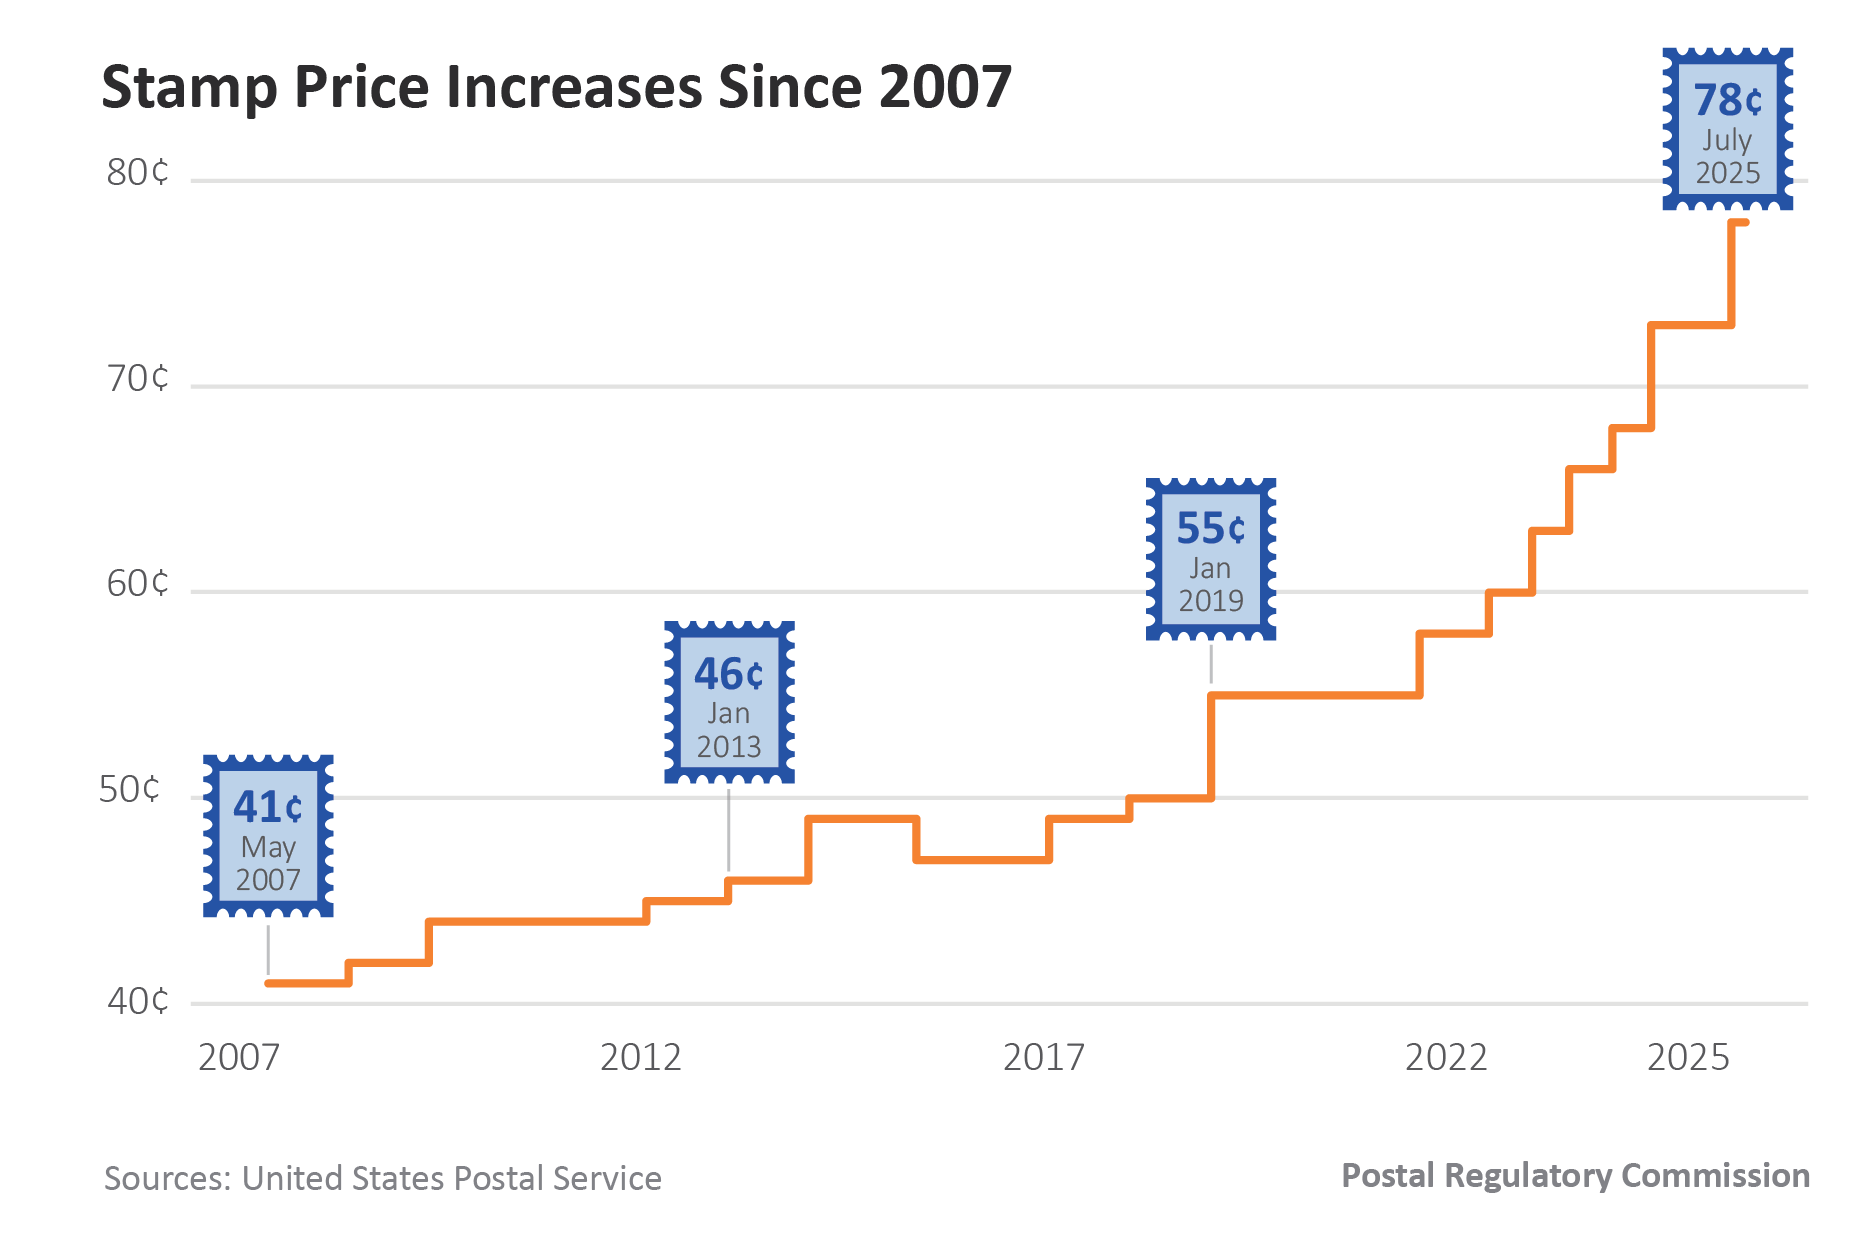
The Postal Service has been increasing rates as its costs go up. The Postal Service raised the rate of the forever stamp from $0.73 in January of 2024 to $0.78 in July of 2025.
Data source: Rates for Domestic Letters
Further Insight
OPERATIONS
Total Factor Productivity is the measure of change in resources that the Postal Service uses as its workload changes.
TOTAL FACTOR PRODUCTIVITY
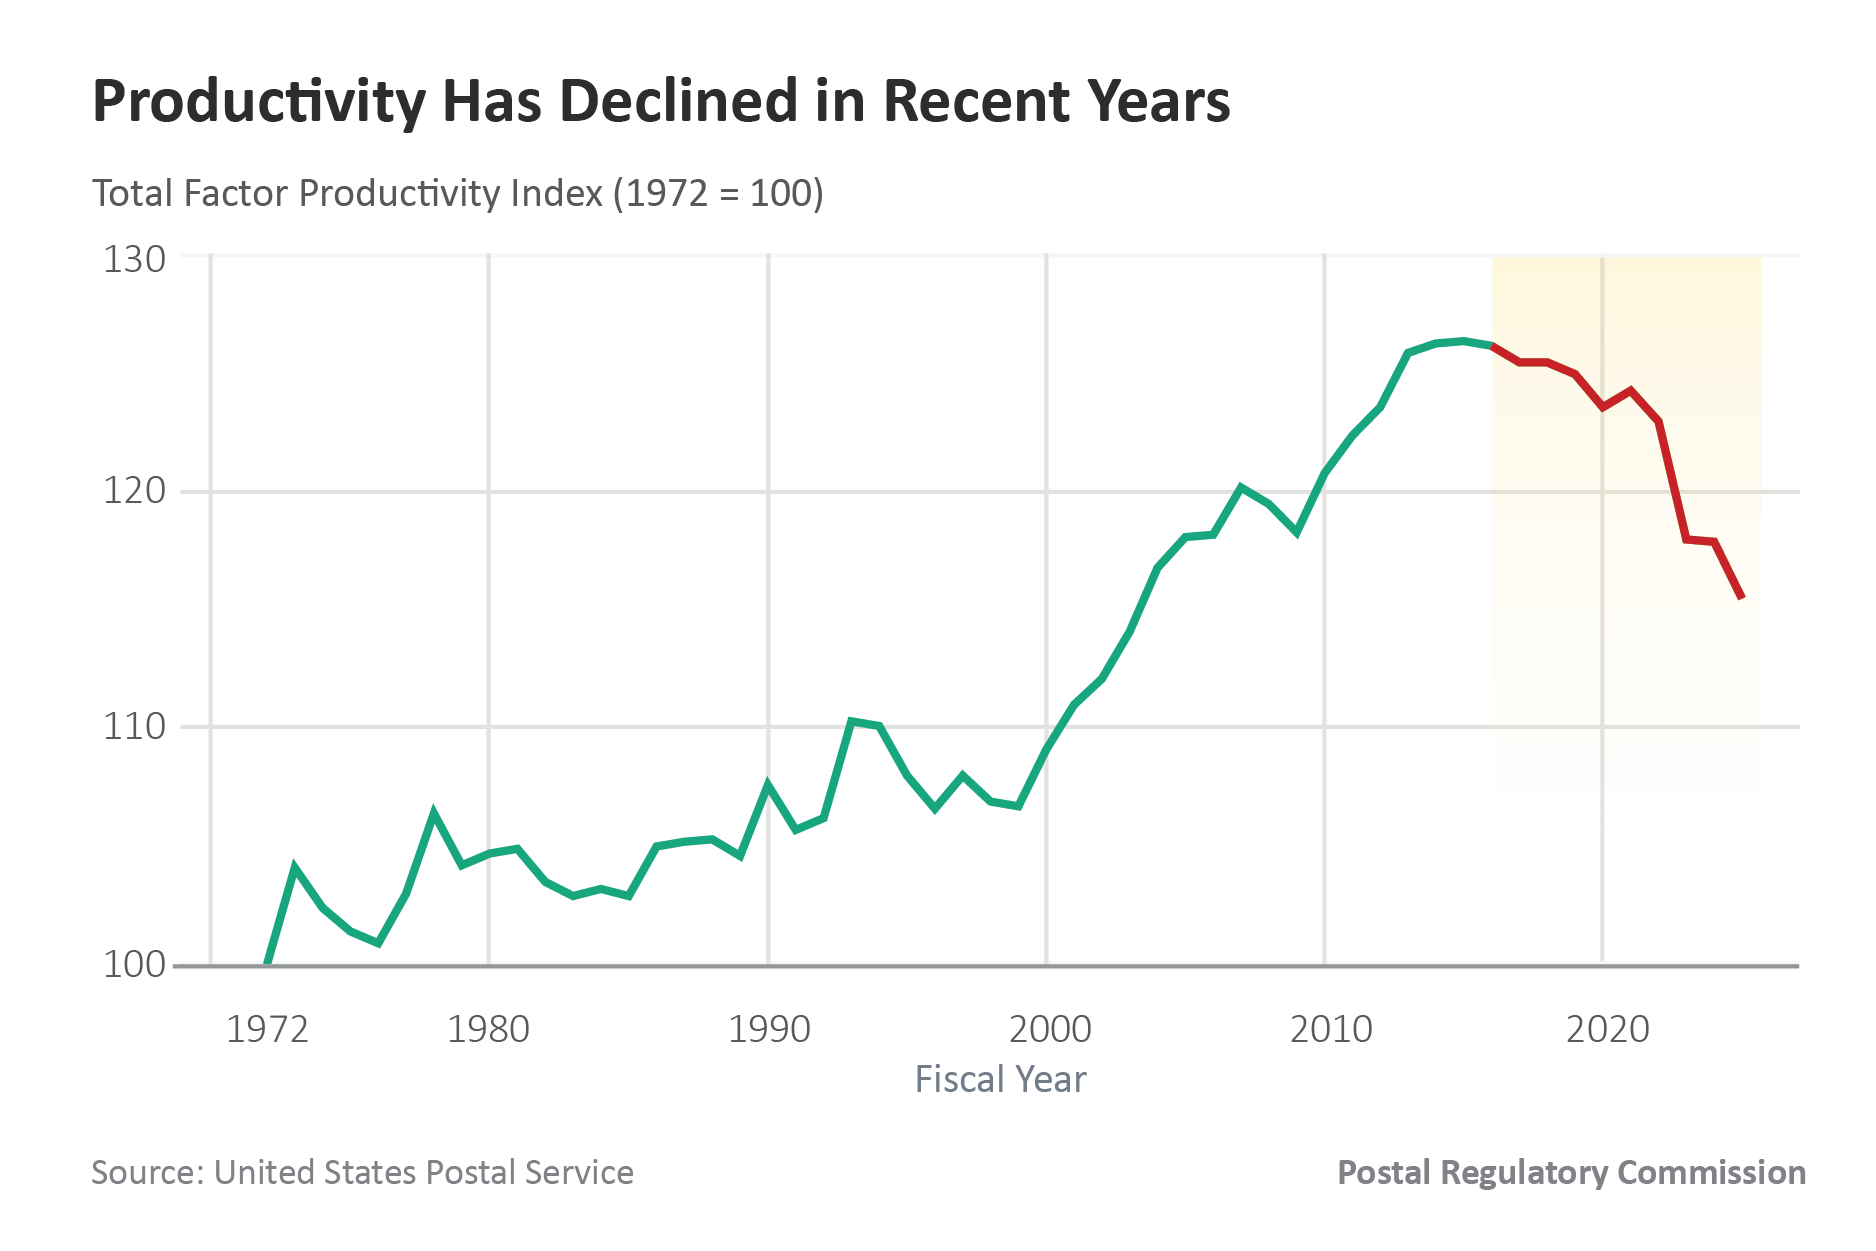
The Postal Service's workload changes as both mail volume and the size of its delivery network change.
Since mail volume and delivery network have unique requirements for resources, the Postal Service responds to changes in workload components by adjusting each component of its resources: labor, material, and capital. To remain productive, the Postal Service must respond to overall changes in workload with adequate changes in its overall use of resources.
Historically, the two workload components (volume and delivery network) generally increased from year to year, and the accompanying changes in resources typically led to improved productivity.
In 2000, mail volume started to decline while new delivery points continued to be added to the network, which combined to declines in overall workload. Up until 2015, the Postal Service responded to workload declines with greater reductions in resources, which led to increased productivity.
Since then, the reductions in the Postal Service's resource use were not adequate for the declining workload, and its productivity began to decline. In the last 10 years (between 2016 and 2025), the Postal Service lost productivity gains that it accomplished in previous 16 years (between 2000 and 2015).
Data source: Financial Report (FY 2025) [PDF]