


FY 2025 ACD Highlights
ACD Highlights in 12 Charts
On March 27, 2026, the Commission issued its FY 2025 Annual Compliance Determination (ACD), assessing the Postal Service's compliance with the law, Commission regulations, and its service standards. Key findings include:
- Covering Costs
In FY 2025, 4 of the Postal Service's 28 Market Dominant products did not cover their costs, the same products as last year, resulting in a combined negative contribution of $0.7 million. Overall, Market Dominant products and services generated $45.8 billion in revenue against $22.5 billion in costs.
Market Dominant Product Compliance Results for FY 2025
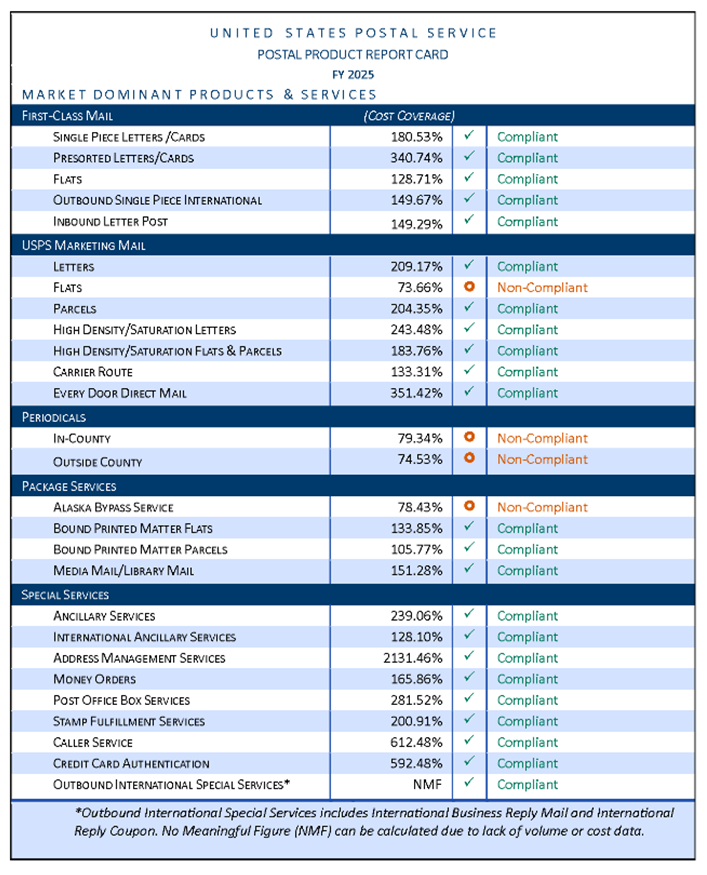
Source: Figure III-1, FY 2025 ACD at 27.
- Rate Authority
In FY 2025, the Postal Service filed one Market Dominant rate case, R2025-1. The Commission granted rate authority derived from multiple sources—CPI-U, density, and retirement authorities—along with an additional 2 percent for Periodicals as a non-compensatory class. This expanded pricing authority aims to improve cost coverage while maintaining protections for ratepayers.
Available Rate Authority by Case
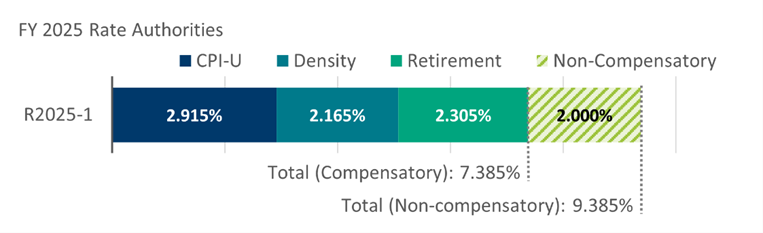
Source: Figure II-1, FY 2025 ACD at 12.
- Sharing the Work
Workshare discounts are cost discounts for mailers when they take on some of the burden of preparing the mail for mailing. The target percentage is 100 percent, meaning that the discount offered by the Postal Service matched how much money the Postal Service saved by not doing the work itself. Discounts are set in comparison to the most recently available avoided costs. All discounts in FY 2025 complied with regulations when they were set.
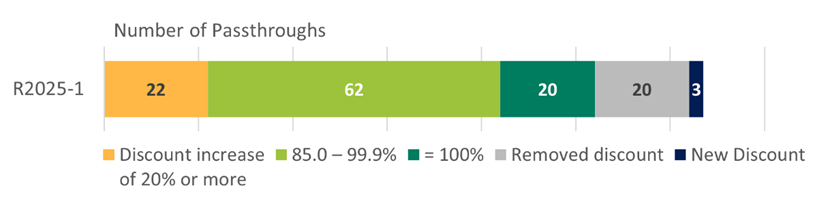
Source: Figure II-2, FY 2025 ACD at 15.
- Getting Your Packages to You
The Postal Service had 4289 active domestic contracts with private businesses and other entities to ship items via the USPS' portfolio of package products in FY 2025. This is a 255.9 percent increase from FY 2024, a year in which the Postal Service had 1205 active competitive domestic NSAs.
Click here for link to NSA dashboard on Commission's website.
Competitive Domestic NSA Products in Effect During FY 2025
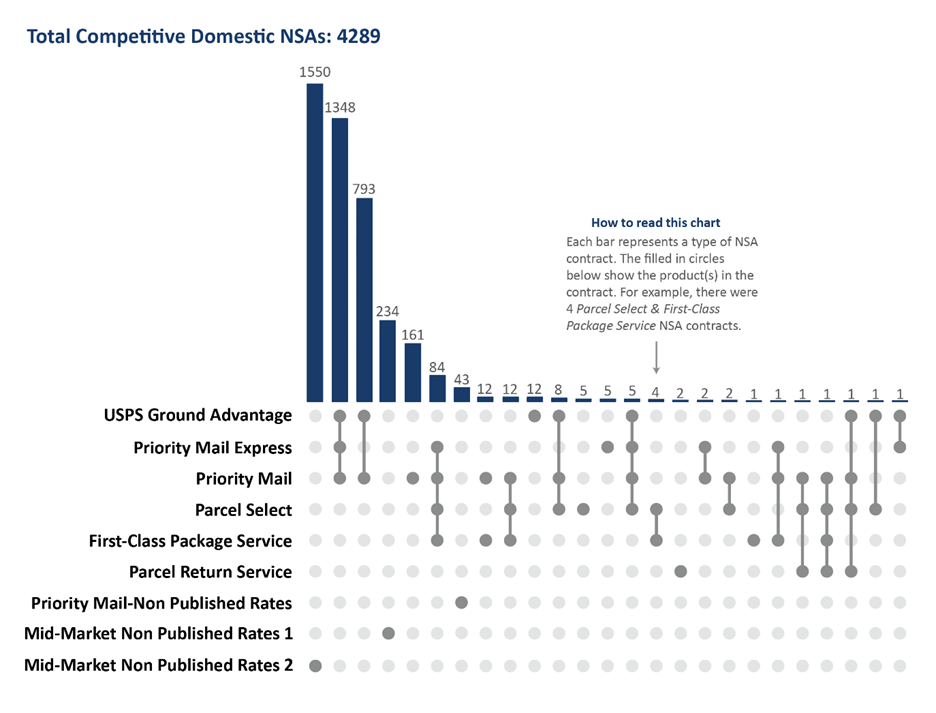
Source: Figure IV-1, FY 2025 ACD at 53.
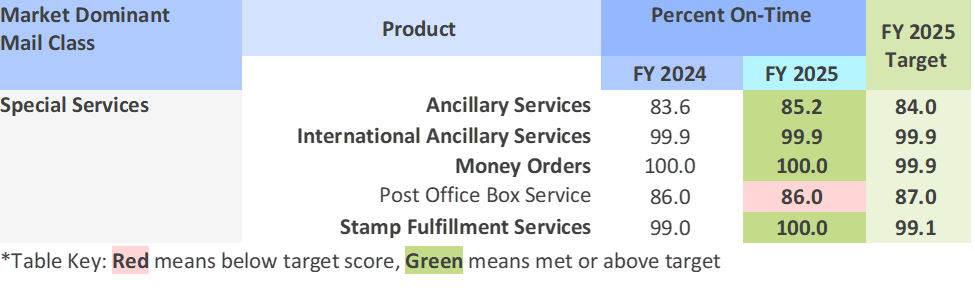
- What Is and Is Not On-Time
The Commission monitors 27 Market Dominant products/categories when it comes to Service Performance. Out of the 27, 7 met their service performance target while 20 failed to meet theirs.
Market Dominant Products Service Performance Results, FY 2025
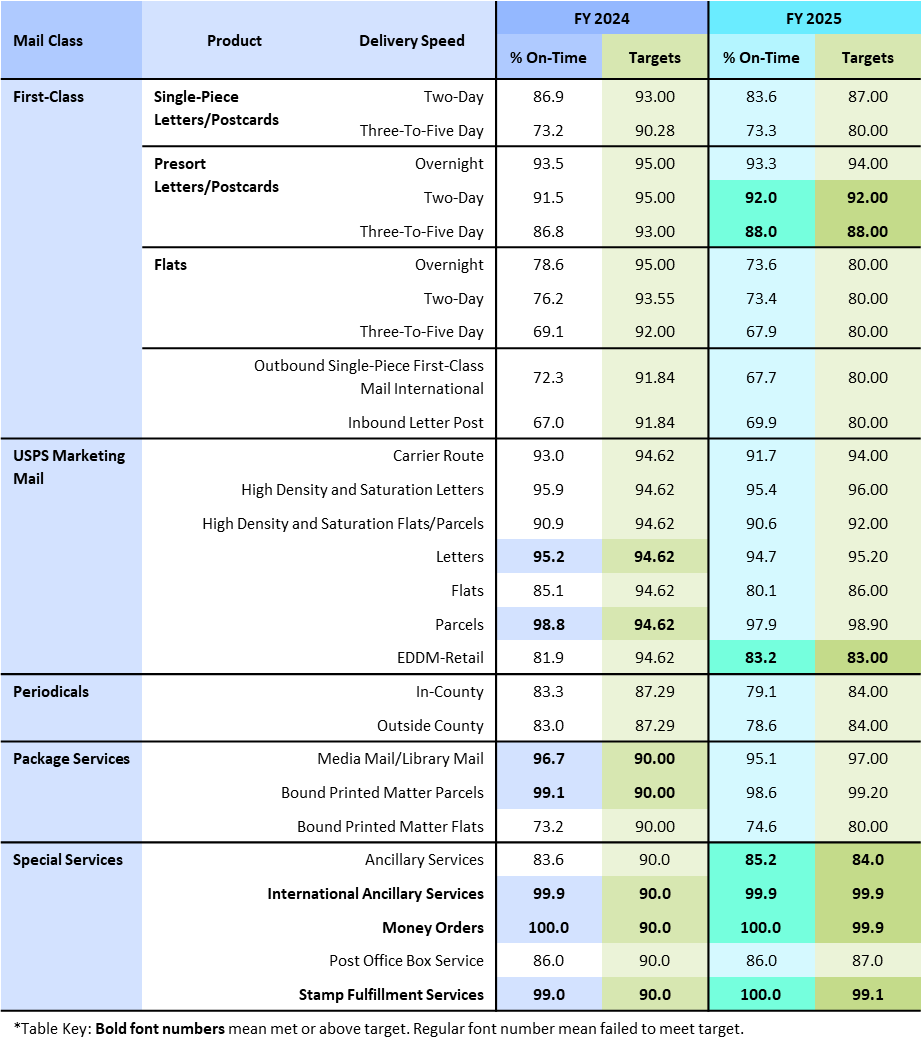
Source: Table VI-1, FY 2025 ACD at 73.
Source: Table VI-1, FY 2025 ACD at 73.
- Physical Locations
The Postal Service relies on its physical network to process, transport, and deliver mail, as well as serve customers. The Commission monitors the number of these facilities to ensure nationwide access. Between FY 2024 and FY 2025, the total number of locations decreased by 406.
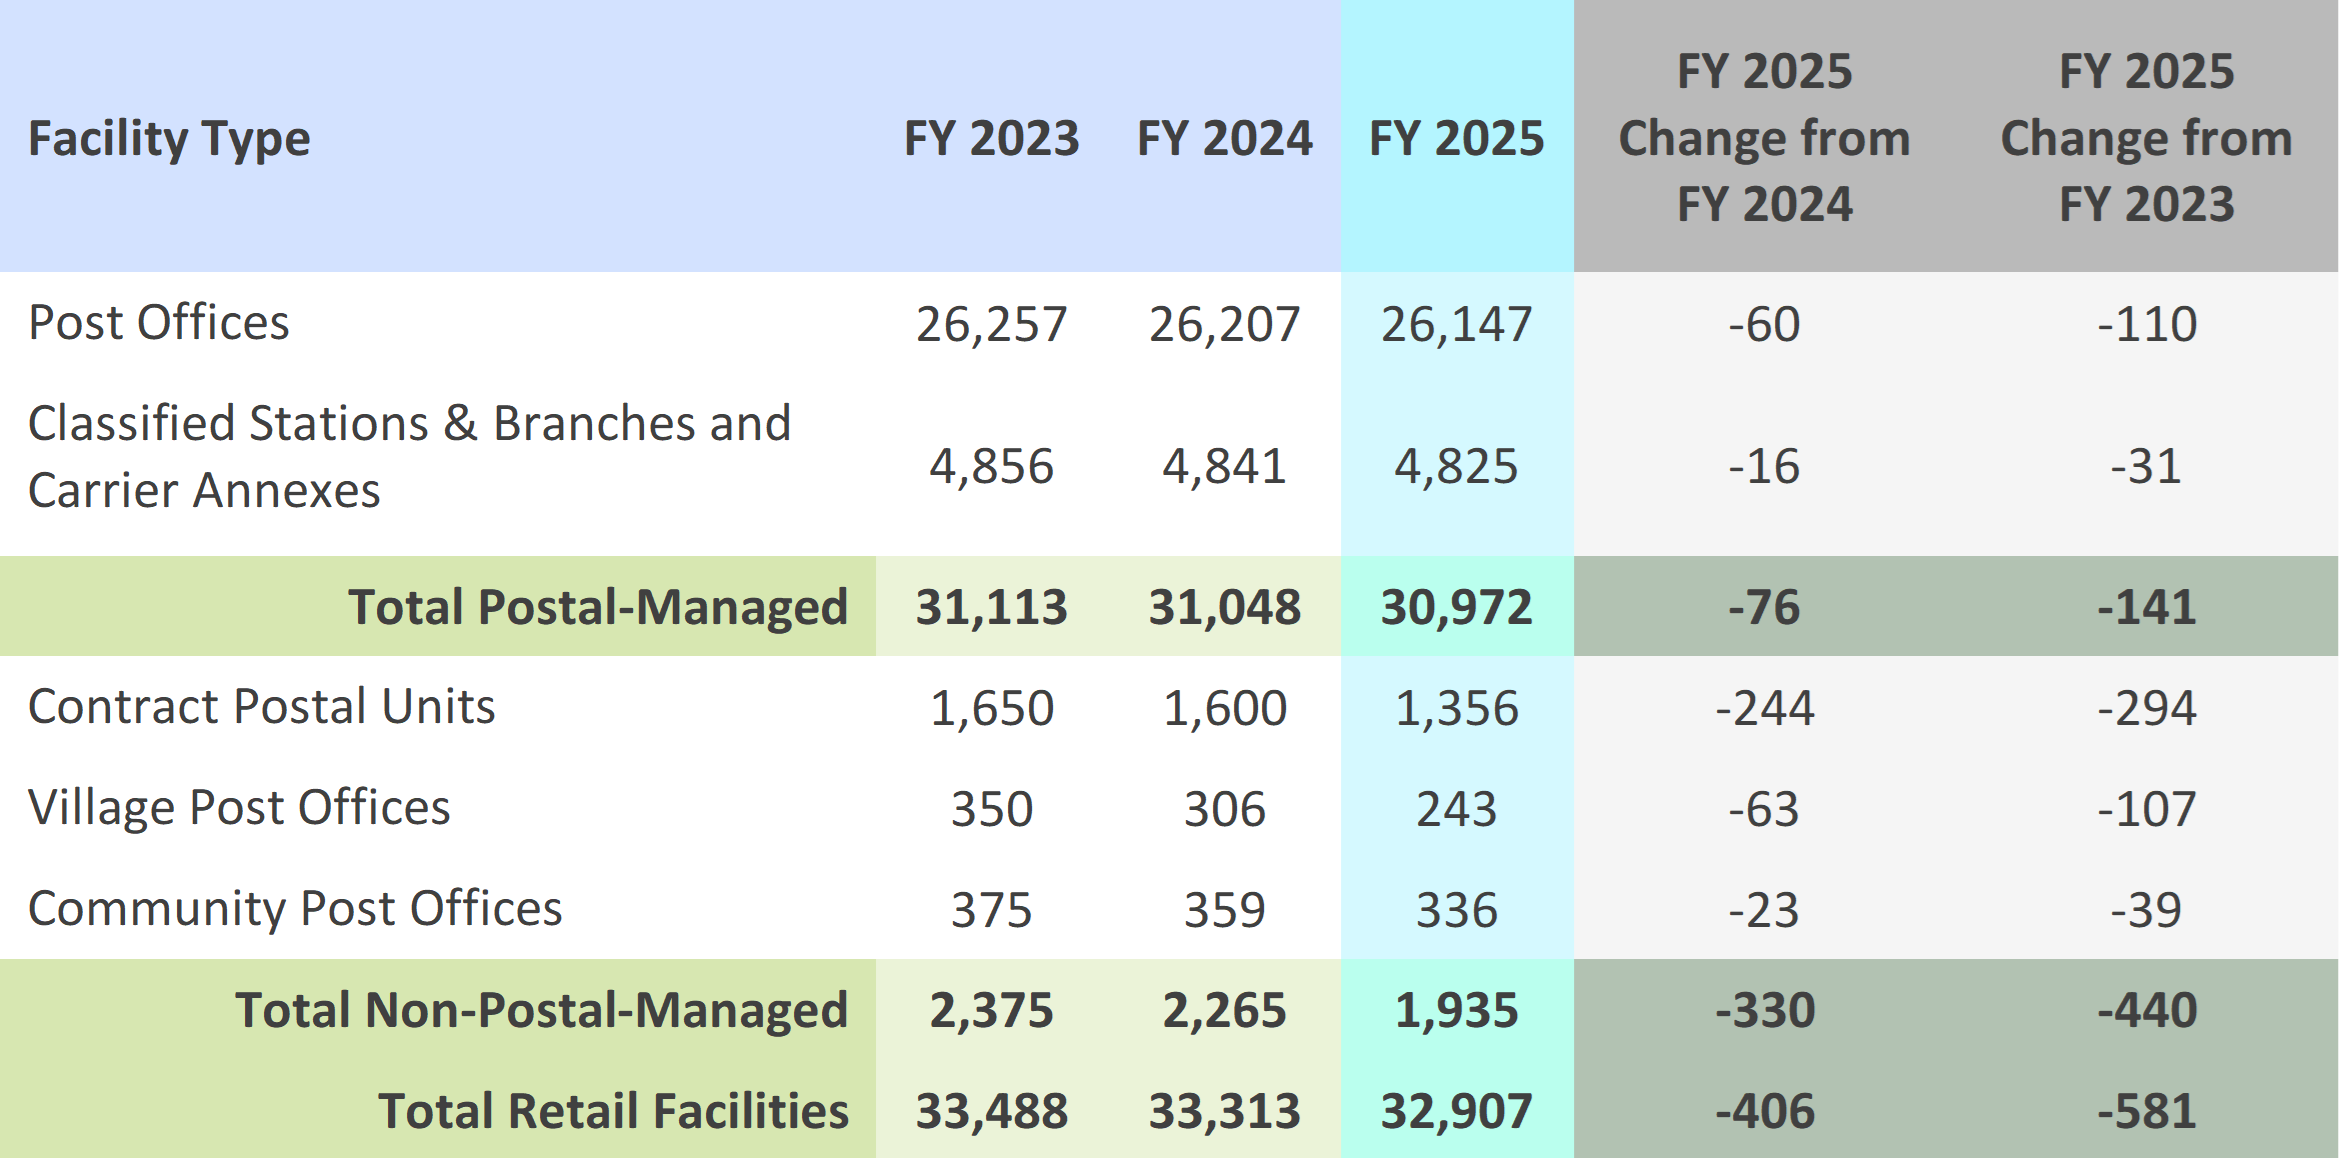
Source: Table VI-3, FY 2025 ACD at 99.
- Post Office Suspensions
The Postal Service temporarily suspends operations at post offices for reasons such as lease terminations or facility damage. The number of suspended sites declined between FY 2024 and FY 2025 by 6.3 percent.
Post Office Suspension Activity During FY 2025
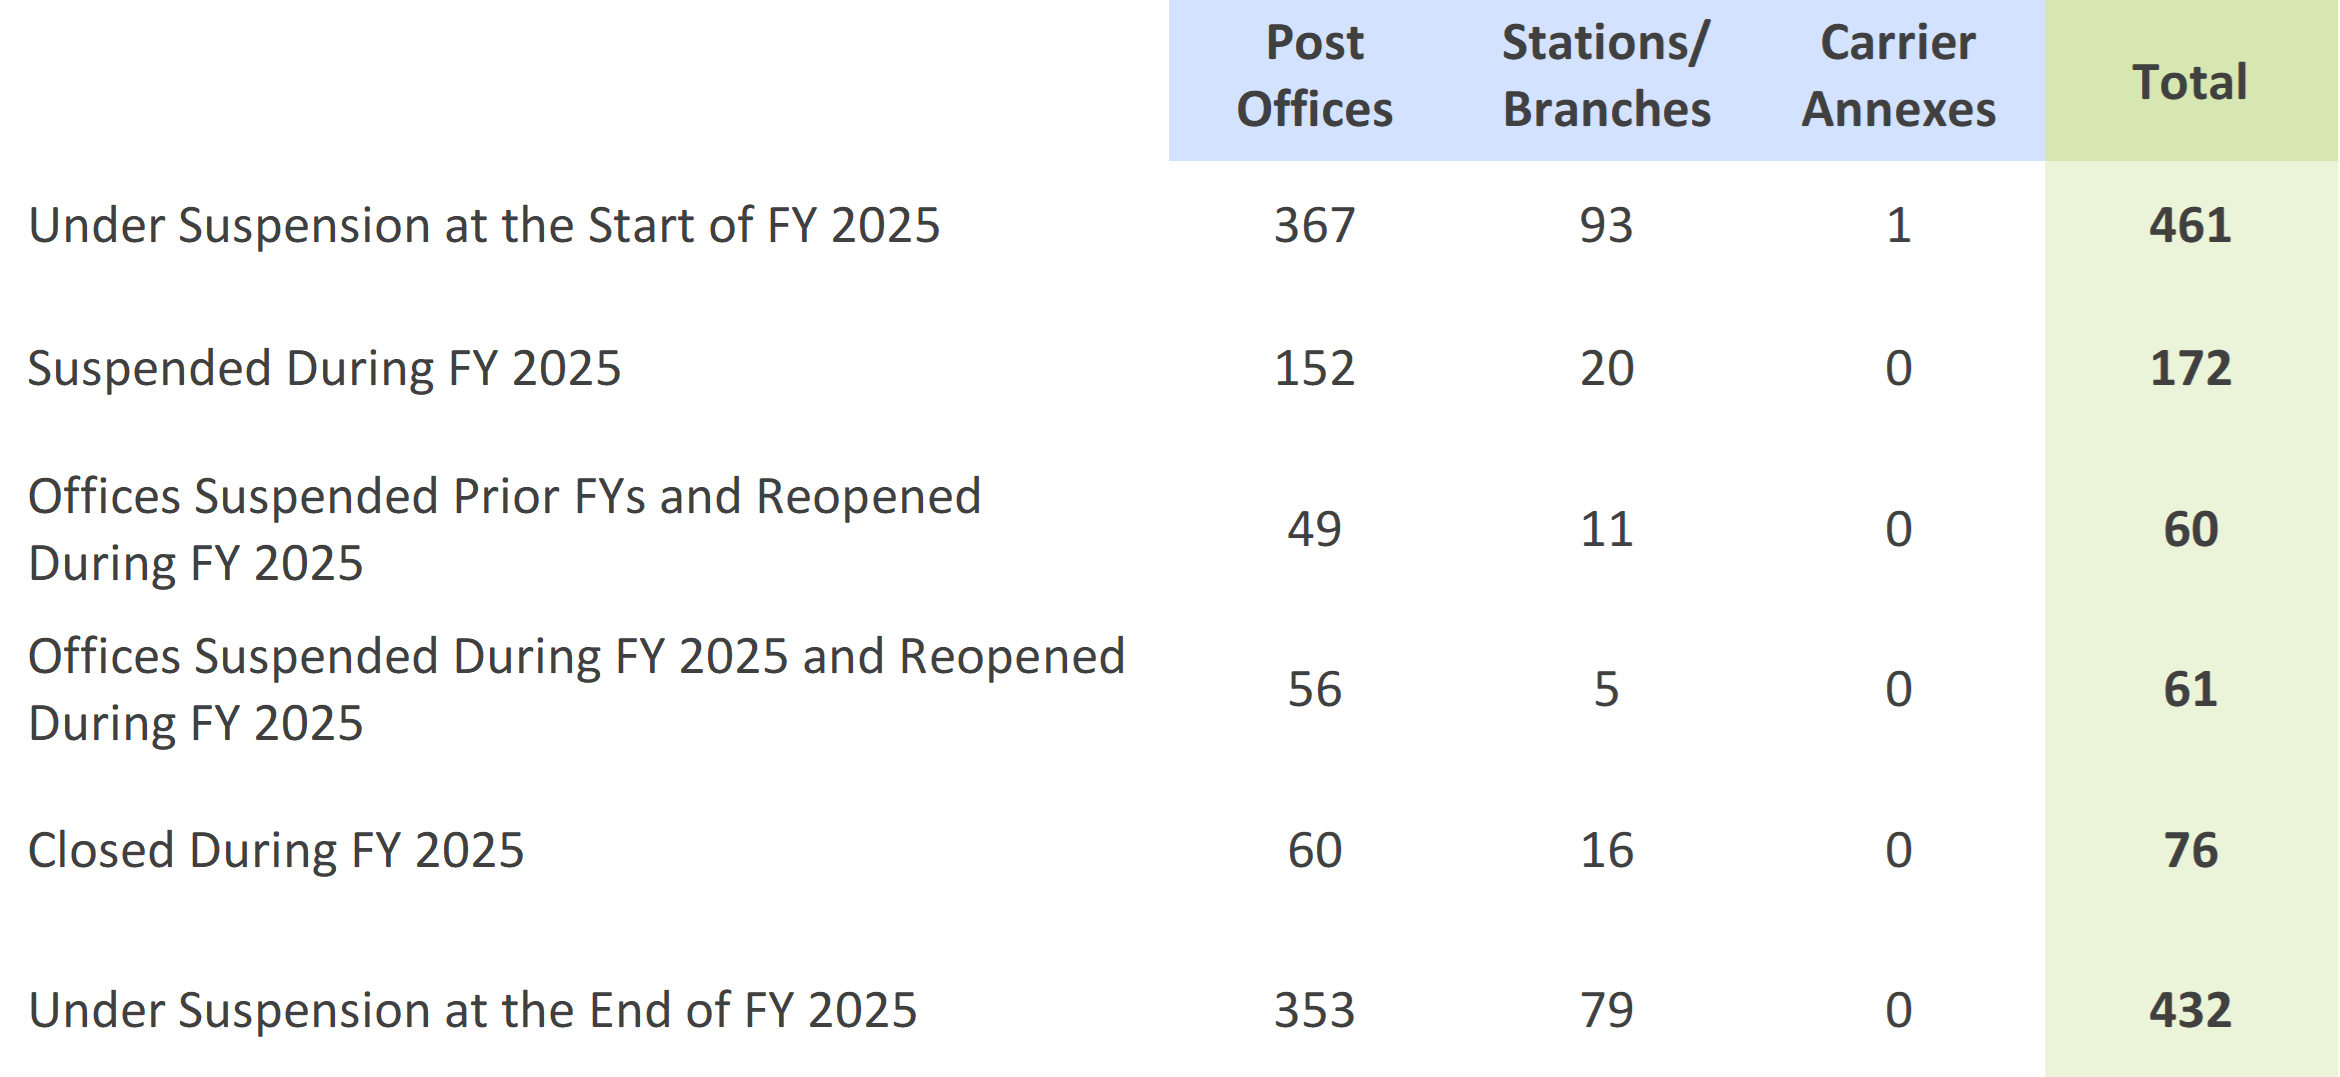
Source: Table VI-4, FY 2025 ACD at 102.
- Didn't I Used to Get More Mail?
The Commission tracks the average volume per delivery point. In FY 2025, the Postal Service delivered about 108.7 billion pieces of mail across 170.4 million delivery points; averaging 638 pieces per delivery point for the year.
Volume per Delivery Point, FY 2021–FY 2025
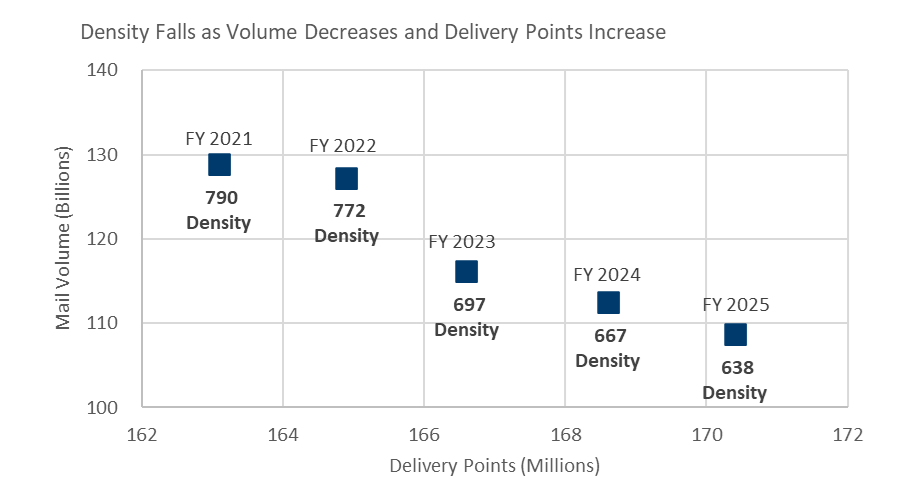
Source: Figure VI-15, FY 2025 ACD at 106.
- "Where Did the Blue Box Go?"
The Commission tracks the number of collection points available to the public, such as the blue boxes seen around city and neighborhood streets. The Postal Service reduced their collection boxes by 9,769 this year, a decrease of 7.4 percent compared to last year. Decisions to add, remove, or relocate collection boxes are based on the results of the Postal Service's annual density test, which evaluates how often individual boxes are used. As mail volumes decline, fewer collection boxes are required to serve the broader public.
Number of Collection Boxes, FY 2021–FY 2025
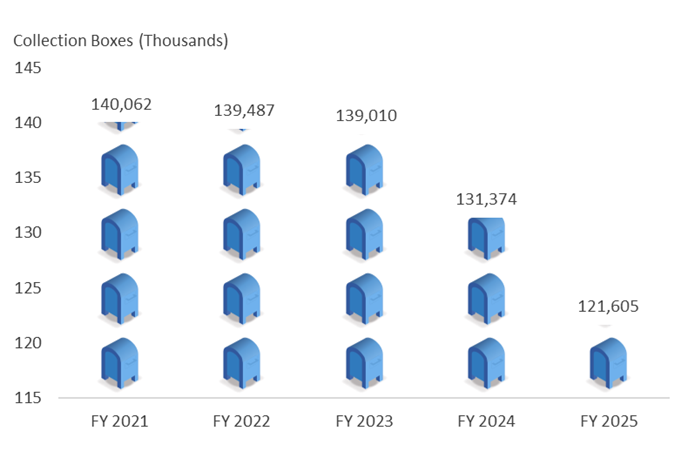
Source: Figure VI-16, FY 2025 ACD at 107.
- Customer Wait Times
The Postal Service reports national average customer wait times for retail service. FY 2025 saw a slight improvement in national wait time relative to FY 2024 and tremendous improvement relative to FY 2021, which was the longest wait time over the past five years. There remains room for improvement, as the Postal Service strives to continue to reduce wait time by emphasizing the use of Self-Service Kiosks and Rapid Drop-off Stations to retail customers.
National Average Wait Time in Line (in Minutes) Annually and by Quarter, FY 2021–FY 2025
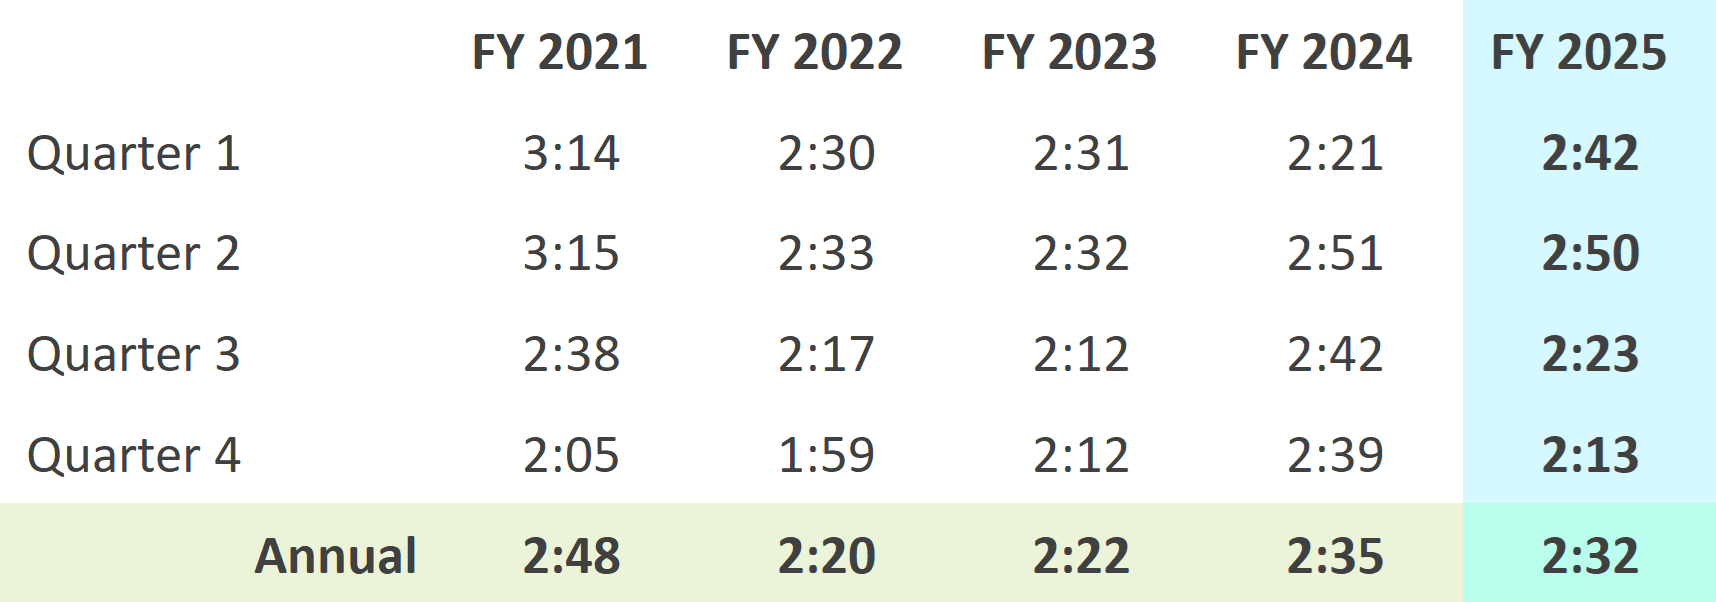
Source: Table VI-5, FY 2025 ACD at 108.
- Flats Return to Profitability
Contribution—the revenue remaining after covering attributable costs—rose to $862 million, a significant turnaround from prior years when total revenue failed to cover costs for flats. FY 2025 marked the second consecutive year that flat-shaped mail in total contributed positively to the Postal Service's finances.
Flats Contribution, ($ Millions), FY 2021–FY 2025
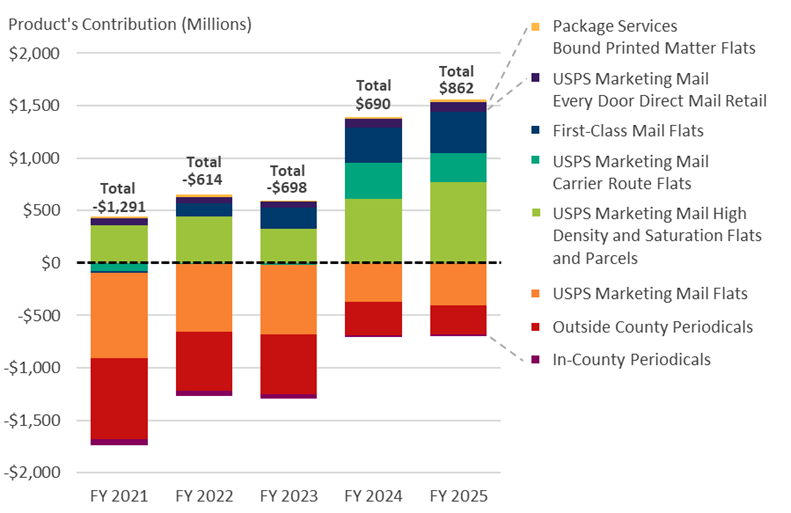
Source: Figure VII-2, FY 2025 ACD at 125.
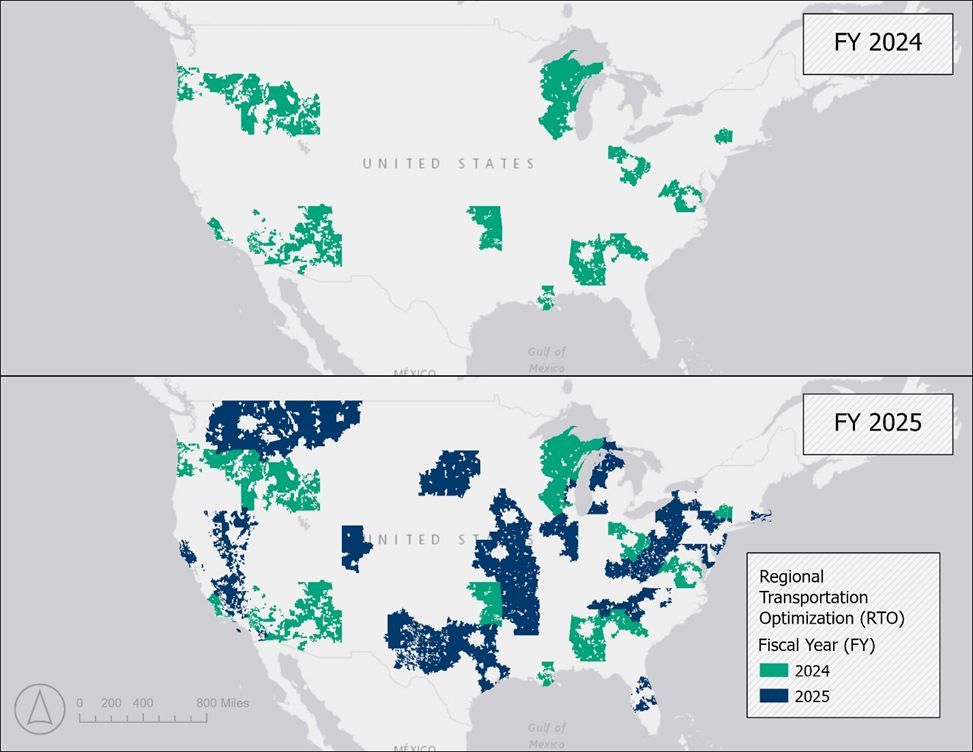
- How's RTO Going?
Regional Transportation Optimization (RTO) is a Postal Service initiative to rationalize local transportation and aims to improve the middle-mile processing operations. The Postal Service designated 28,540 5-Digit ZIP Codes to be a part of the RTO initiative. Thus far, 10,026 5-Digit ZIP Codes have been affected by RTO implementation.
5-Digit ZIP Codes Affected by RTO Implementation,FY 2024–FY 2025
Source: Figure VII-8, FY 2025 ACD at 140.