


FY 2024 ACD Highlights
Highlights in 11 Charts
The Commission released the FY 2024 Annual Compliance Determination (ACD) on March 31^, 2025, reviewing the Postal Service’s compliance with the law, Commission regulations, and its service standards. Here are some of the ACD’s key findings:
1. Covering Costs
Out of the Postal Service’s portfolio of 28 Market Dominant products, four products failed to cover their cost in FY 2024, leading to a total of $705.8 million in negative contribution from those four products. Last year, five products failed to cover costs. Overall, Market Dominant products and services brought in $44.9 billion in revenue and incurred $22.6 billion in costs in FY 2024.
Market Dominant Product Compliance Results for FY 2024
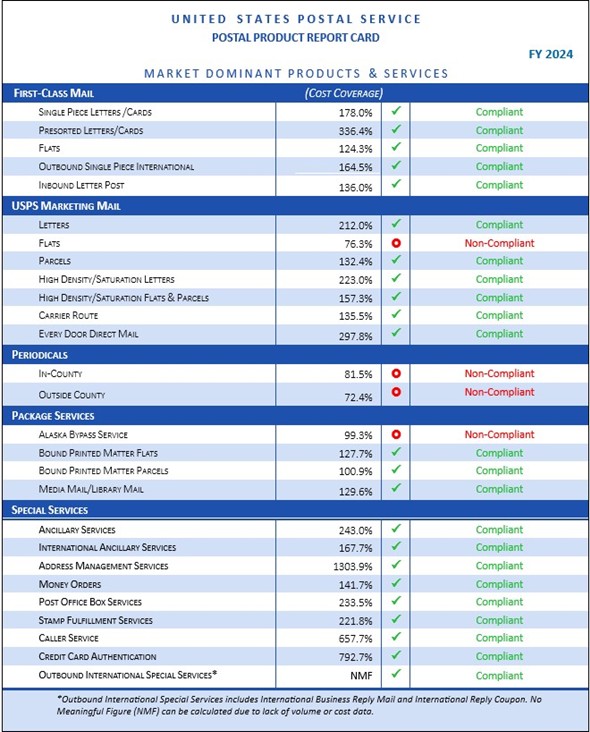
Source: Figure III-1, FY 2024 ACD Section II.A.
2. Rate Authority
In FY 2024, the Postal Service brought two Market Dominant rate cases before the Commission, Docket No. R2024-1 and Docket No. R2024-2. As indicated by the figure below, the rate authority granted to the Postal Service in Docket No. R2024-1 was entirely from CPI-U. In Docket No. R2024-2 the Postal Service saw rate authority granted not only from CPI-U, but from density and retirement authorities, along with an additional two percent for Periodicals for being a non-compensatory class.
Available Rate Authority by Case
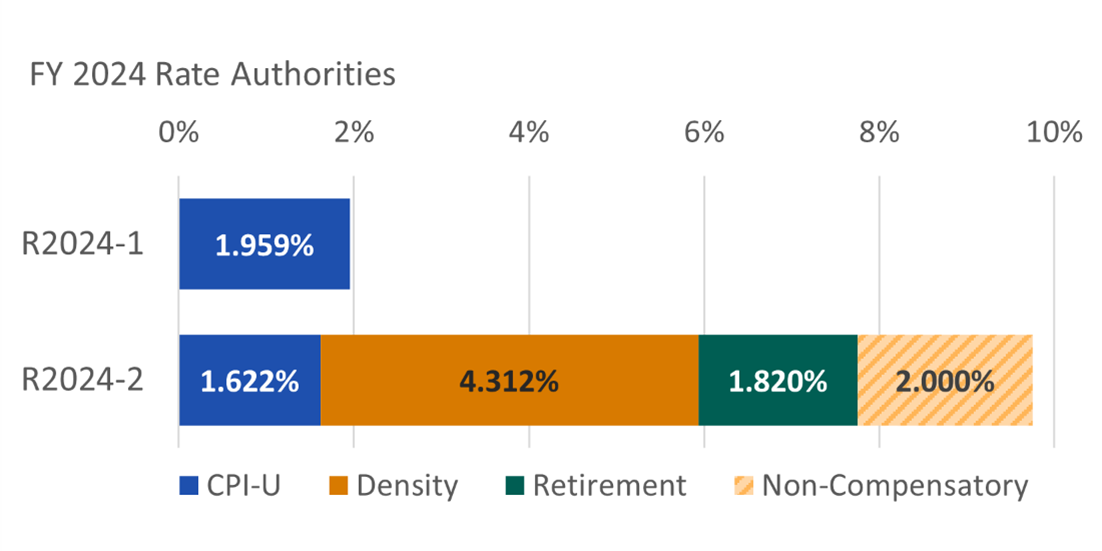
Source: Figure II-1, FY 2024 ACD Section II.B.
3. Sharing the Work
Workshare discounts are cost discounts for mailers when they take on some of the burden of preparing the mail for mailing. The target percentage is 100 percent, meaning that the discount offered by the Postal Service matched how much money the Postal Service saved by not doing the work itself. Discounts are set in comparison to the most recently available avoided costs. All discounts in FY 2024 complied with regulations when they were set.
Workshare Discount Passthrough Compliance by Rate Case
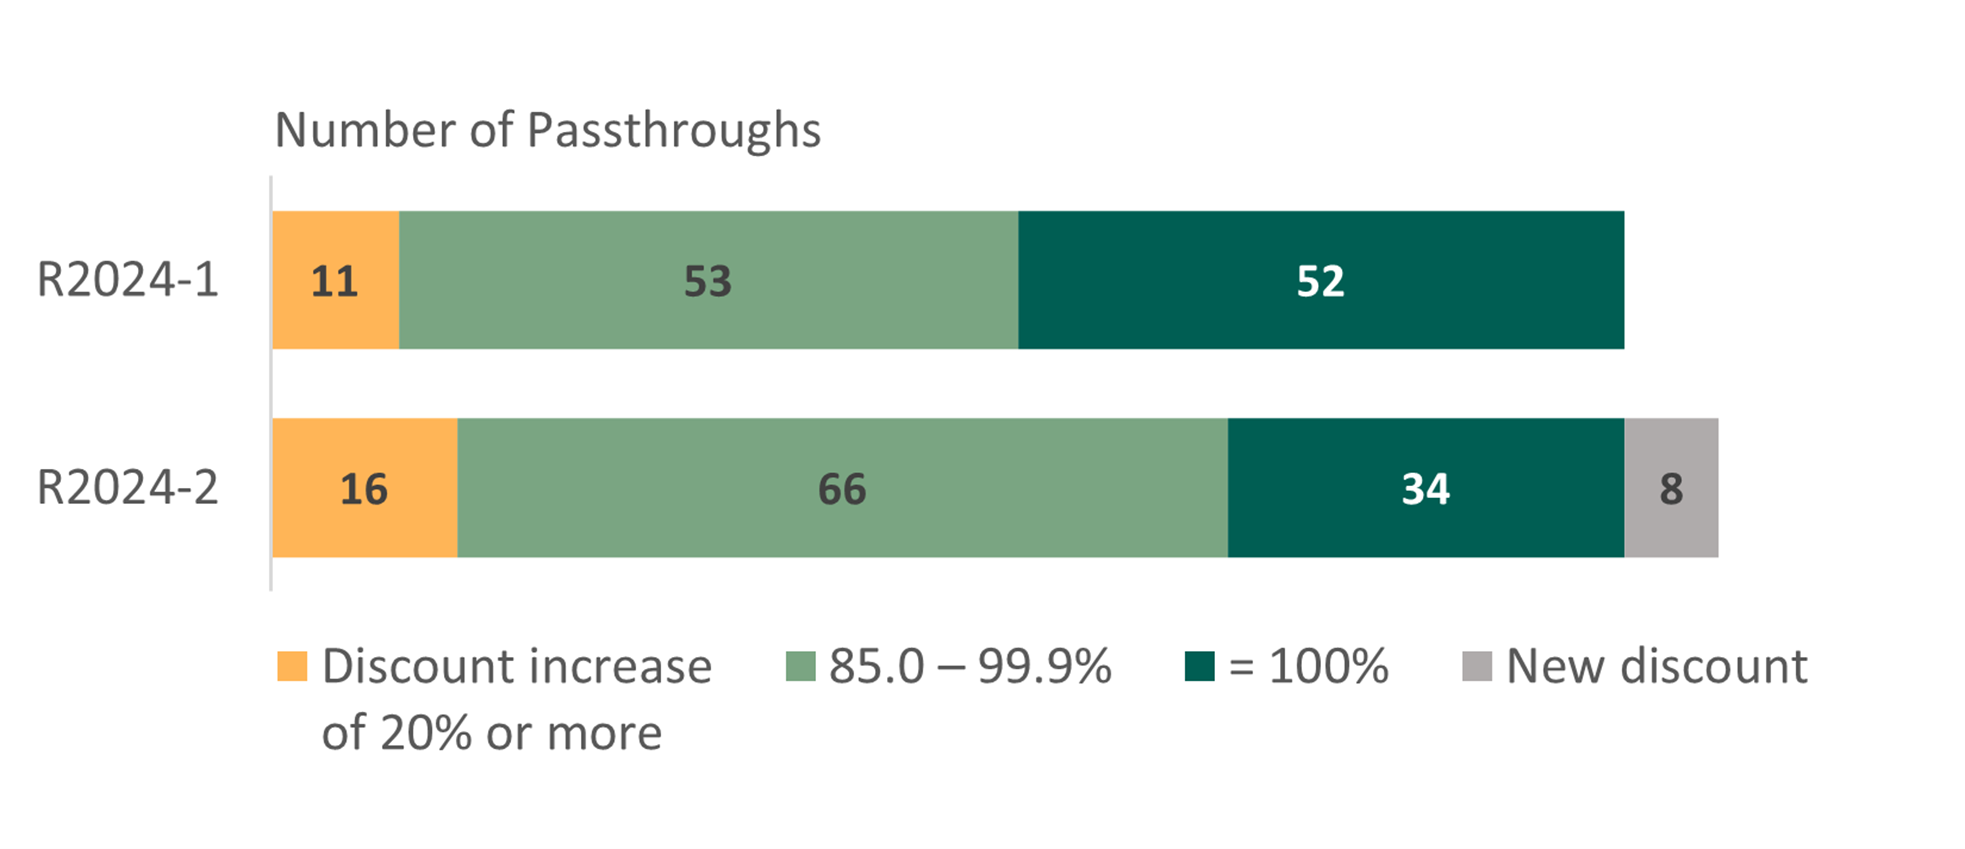
Source: Figure II-2, FY 2024 ACD Section II.C.2.
4. Getting Your Packages to You
The Commission plays a critical role in approving agreements between private businesses and the government’s postal operator, ensuring these agreements cover their costs and do not unfairly compete with private package carriers. The Postal Service had 1205 active domestic contracts with private businesses and other entities to ship items via the USPS’ portfolio of package products in FY 2024. This is a 40.8 percent increase from FY 2023, a year in which the Postal Service had 856 active competitive domestic NSAs. The Postal Service also maintained 252 international NSAs in FY 2024.
Click here for link to interactive NSA dashboard on Commission’s website.
Competitive Domestic NSA Products in Effect During FY 2024
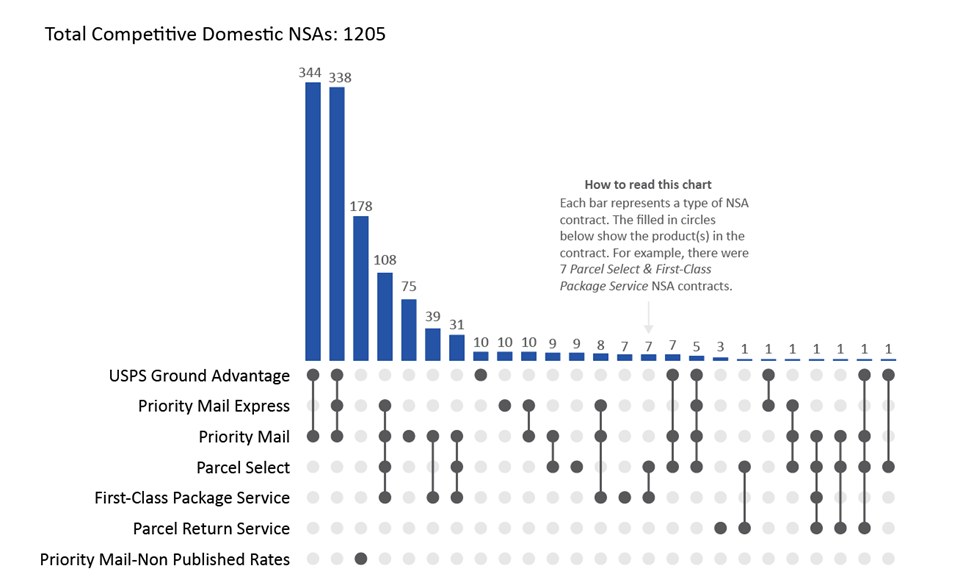
Source: Figure IV-1, FY 2024 ACD Section VI.C.2^.
5. What Is and Is Not On-Time
The Commission monitors 27 Market Dominant products/categories when it comes to Service Performance, which is the percentage of mail delivered within the Postal Service’s service standards. Out of the 27, 8 met their service performance target while 19 failed to meet theirs.
Market Dominant Products Service Performance Results, FY 2024
Mail Class | Product | Delivery Speed | % On-Time* | Target |
First-Class Mail | Single-Piece Letters/Postcards | 2-Day | 86.90 | 93.00 |
3-5-Day | 73.20 | 90.28 | ||
Presort Letters/Postcards | Overnight | 93.50 | 95.00 | |
2-Day | 91.50 | 95.00 | ||
3-5-Day | 69.10 | 93.00 | ||
Flats | Overnight | 78.60 | 95.00 | |
2-Day | 76.20 | 93.55 | ||
3-5-Day | 69.10 | 92.00 | ||
Outbound Single-Piece First-Class Mail International | - | 72.30 | 91.84 | |
Inbound Letter Post | - | 67.00 | 91.84 | |
USPS Marketing Mail | Carrier Route | - | 93.00 | 94.62 |
High Density and Saturation Letters | - | 95.90 | 94.62 | |
High Density and Saturation Flats/Parcels | - | 90.90 | 94.62 | |
Letters | - | 95.20 | 94.62 | |
Flats | - | 85.10 | 94.62 | |
Parcels | - | 98.80 | 94.62 | |
EDDM-Retail | - | 81.90 | 94.62 | |
Periodicals | In-County | - | 83.00 | 87.29 |
Outside County | - | 83.00 | 87.29 | |
Package Services | Media/Library Mail | - | 96.70 | 90.00 |
Bound Printed Matter Parcels | - | 99.10 | 90.00 | |
Bound Printed Matter Flats | - | 73.20 | 90.00 | |
*Red means below the target score; Green means met or above the target score. | ||||
Source: Table VI-1, FY 2024 ACD at Section VI.A.2.a.
Mail Class | Product | % On-Time* | Target |
Special Services | Ancillary Services | 83.60 | 90.00 |
International Ancillary Services | 99.90 | 90.00 | |
Money Orders | 100.00 | 90.00 | |
Post Office Box Service | 86.00 | 90.00 | |
Stamp Fulfillment Services | 99.00 | 90.00 | |
*Red means below the target score; Green means met or above the target score. | |||
Source: Table VI-2, FY 2024 ACD Section VI.A.2.a.
6. Election Mail and Political Mail
The Postal Service delivered approximately 194 million Election Mail pieces and 1.1 billion Political Mail pieces in FY 2024 (October 2023 - September 2024). As for the entire 2024 election cycle (Quarter 1 FY24 – Quarter 1 FY25), the Postal Service delivered approximately 285 million Election Mail pieces and 2.3 billion Political Mail pieces.
Political Mail and Election Mail, by Month,
October 2023 – December 2024
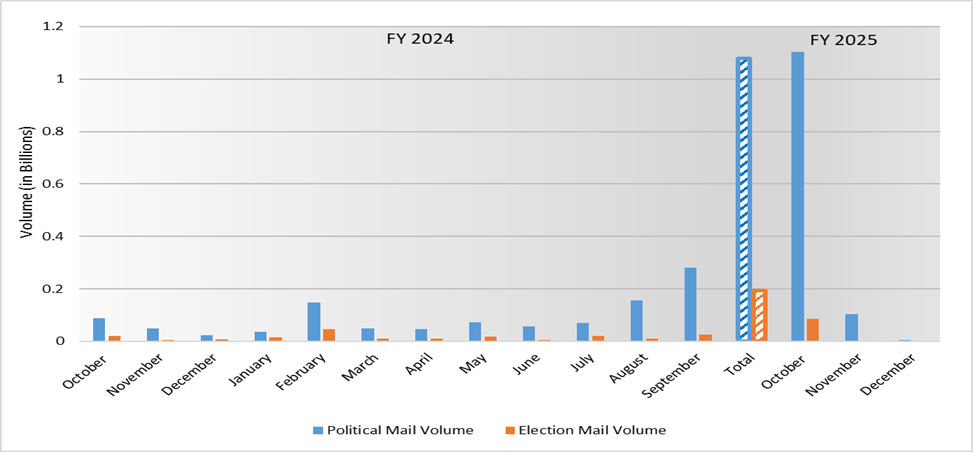
Source: Table VI-9, FY 2024 ACD Section VI.A.5.
7. Physical Locations
The Postal Service interacts with its customers through an extensive network of retail facilities. The Commission monitors these numbers to ensure that the Postal Service maintains its ability to provide access to citizens across the United States. There has been a decrease of 175 retail facilities between FY 2023 and FY 2024.
Facility Type | FY 2022 | FY 2023 | FY 2024 | FY 2024 Change from FY 2023 | FY 2024 Change from FY 2022 |
Post Offices | 26,265 | 26,257 | 26,207 | -50 | -58 |
Classified Stations & Branches and Carrier Annexes | 4,849 | 4,856 | 4,841 | -15 | -8 |
Total Postal-Managed | 31,114 | 31,113 | 31,048 | -65 | -66 |
Contract Postal Units | 1,731 | 1,650 | 1,600 | -50 | -131 |
Village Post Offices | 377 | 350 | 306 | -44 | -71 |
Community Post Offices | 397 | 375 | 359 | -16 | -38 |
Total | 2,505 | 2,375 | 2,265 | -110 | -240 |
Total Retail Facilities | 33,619 | 33,488 | 33,313 | -175 | -306 |
8. Post Office Suspensions
The Postal Service uses the suspension process to halt service at offices for a variety of reasons, such as lease issues or debilitating damage from inclement weather. While the Commission has successfully encouraged the Postal Service to resolve the status of some of its longest suspensions, dating back to 2016 and earlier, the total number of suspended sites has increased between FY 2023 and FY 2024.
Post Office Suspension Activity During FY 2024
Status | Post Offices | Stations | Carrier Annexes | Total |
Under Suspension at the Start of FY 2024 | 335 | 92 | 1 | 428 |
Suspended During FY 2024 | 106 | 23 | 0 | 129 |
Offices Suspended Prior FYs and Reopened During FY 2024 | 24 | 7 | 0 | 31 |
Offices Suspended During FY 2024 and Reopened During FY 2024a | 13 | 3 | 0 | 16 |
Closed During FY 2024 | 51 | 15 | 0 | 66 |
Under Suspension at the End of FY 2024 | 353 | 90 | 1 | 444 |
Source: Table VI-5, FY 2024 ACD Section VI.B.4.b.
9. Didn’t I Used to Get More Mail?
The Commission tracks the average volume per delivery point. The Postal Service handled approximately 112.5 billion pieces of mail in FY 2024 while its delivery point network expanded to 168.6 million locations; meaning that each delivery point received an average of 667 pieces for the year.
Volume per Delivery Point, FY 2020 – FY 2024
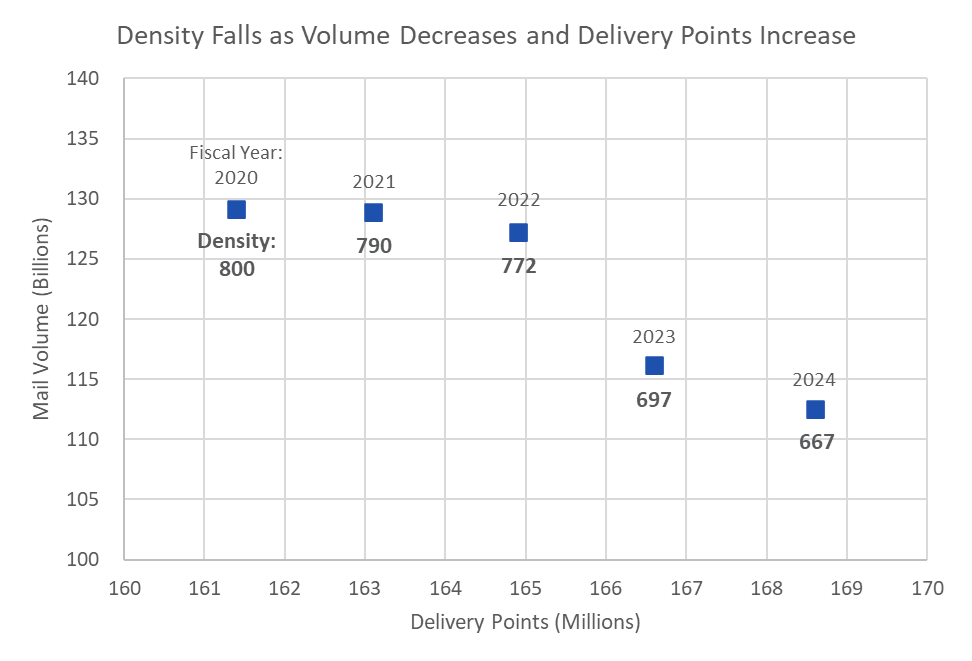
Source: Figure VI-12, FY 2024 ACD at Section VI.B.5
10. Where Did the Blue Box Go?
The Commission tracks the number of collection points available to the public, such as the blue boxes seen around city and neighborhood streets. The Postal Service reduced their collection boxes by 7,636 this year. The decision to add, remove, or relocate comes from the annual density test that is undertaken. In light of falling mail volume, the Postal Service has reduced the number of collection boxes that service the public.
Number of Collection Boxes, FY 2020 – FY 2024
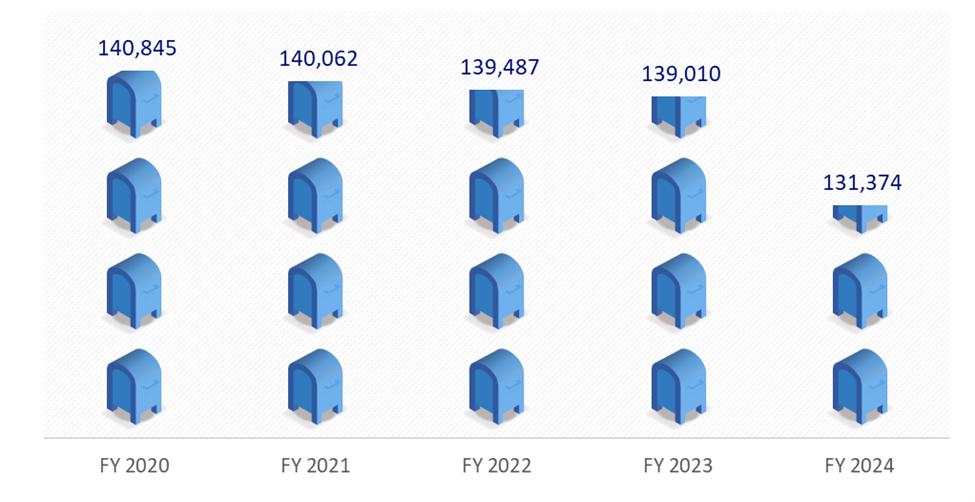
Source: Figure VI-13, FY 2024 ACD Section VI.B.6.
11. Customer Wait Times
The Postal Service reports national average customer wait times for retail service. Between FY 2021 and FY 2022, measures taken by the Postal Service led to an impressive reduction in wait time for customers. However, those efficiencies appear short lived as FY 2024 was the second year in a row of increased average wait time and also the second longest average wait time of the past five years.
National Average Wait Time in Line (in Minutes) by Quarter, FY 2020 – FY 2024
Quarter | FY 2020 | FY 2021 | FY 2022 | FY 2023 | FY 2024 |
Q1 | 1:57 | 3:14 | 2:30 | 2:31 | 2:21 |
Q2 | 2:06 | 3:15 | 2:33 | 2:32 | 2:51 |
Q3 | 2:59 | 2:38 | 2:17 | 2:12 | 2:42 |
Q4 | 3:05 | 2:05 | 1:59 | 2:12 | 2:39 |
Annual | 2:26 | 2:48 | 2:20 | 2:22 | 2:35 |
Source: Table VI-14, FY 2024 ACD Section VI.B.7.