FY 2023 ACD Highlights
Highlights in 12 Charts
The Commission released the FY 2023 Annual Compliance Determination (ACD) on March 28, 2024, reviewing the Postal Service’s compliance with the law, Commission regulations, and its service standards. Here are some of the ACD’s key findings:
1. Covering Costs
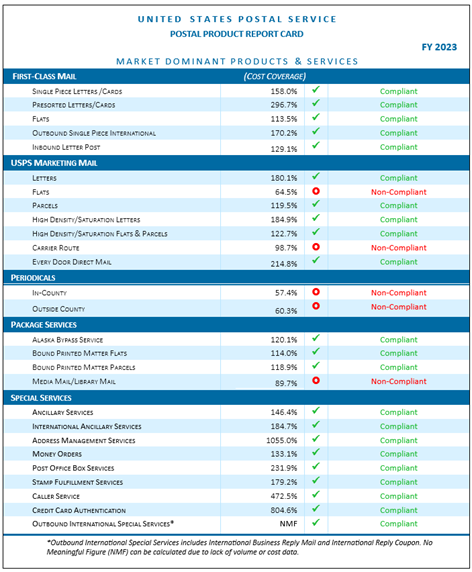
Out of the Postal Service’s portfolio of 28 Market Dominant products, five products failed to cover their cost in FY 2023, leading to a total of $1.3 billion in negative contribution from those five products. Last year, seven products failed to cover costs. Overall, Market Dominant products and services brought in $43.6 billion in revenue and incurred $26.4 billion in costs in FY 2023.
Market Dominant Product Compliance Results for FY 2023
Source: Table III-1, FY 2023 ACD at 20.
2. Rate Authority
In FY 2023, the Postal Service brought two rate cases before the Commission, R2023-1 and R2023-2. As evidenced by the figure below, the primary driver behind the rate authority allotted to the Postal Service was CPI. In each review, the Commission found that the Postal Service complied with the rules surrounding the price cap.
Available Rate Authority by Case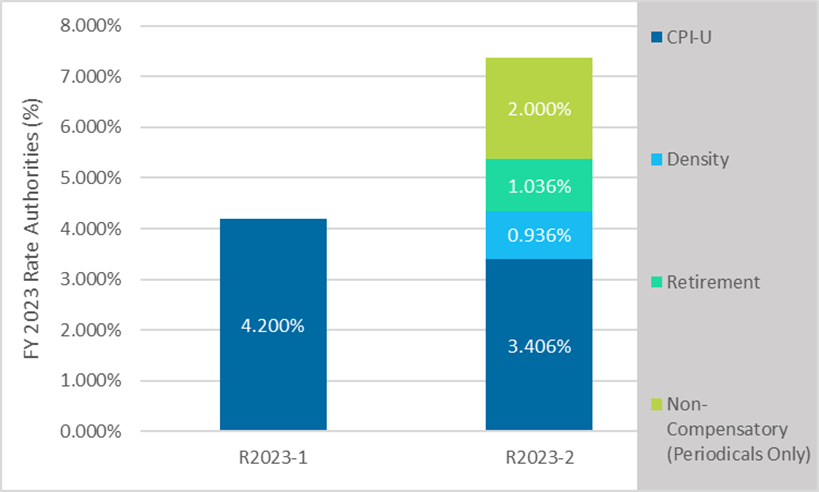
Source: Figure II-1, FY 2023 ACD at 10.
3. Sharing the Work
Workshare discounts are cost discounts for mailers when they take on some of the burden of preparing the mail. The target passthrough percentage is 100 percent, meaning that the discount offered by the Postal Service matched how much money the Postal Service saved by not doing the work itself. Discounts are set in comparison to the most recently available avoided costs. All discounts in FY 2023 complied with regulations when they were set.
FY 2023 Workshare Discount Passthroughs by Compliance Type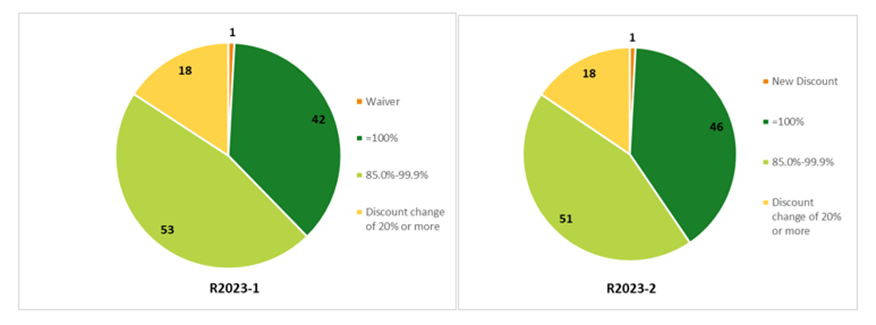
Source: Figure II-2, FY 2023 ACD at 14.
4. Getting Your Packages to You
In FY 2023, the Postal Service had 856 active domestic contracts with private businesses and other entities to ship items via the USPS’ portfolio of package products. This is a 48.9 percent increase from FY 2022, a year in which the Postal Service had 575 active competitive domestic NSAs.
Competitive Domestic NSA Products in Effect During FY 2023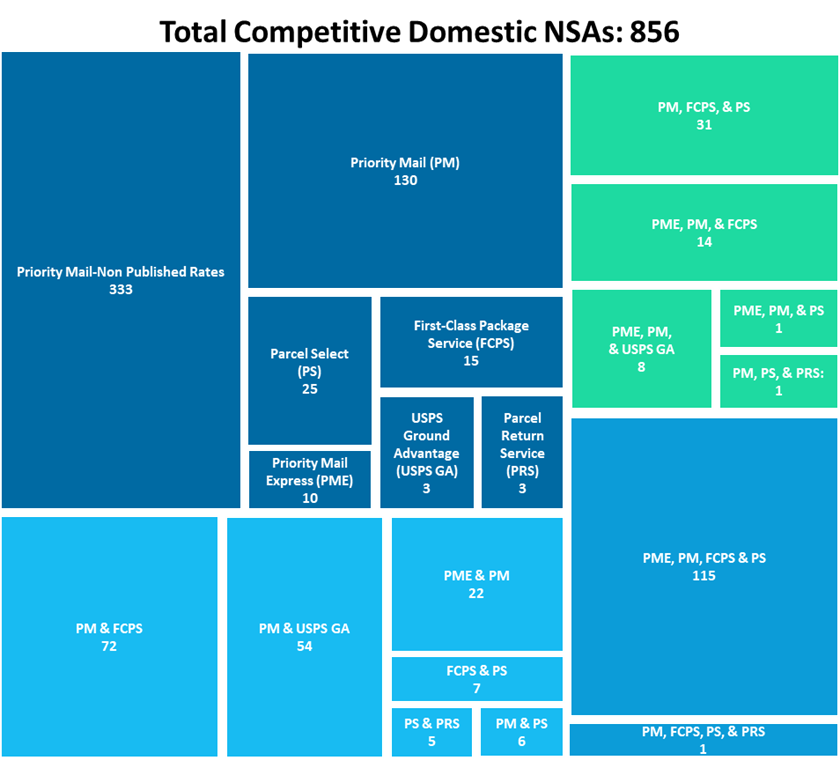
Source: Figure IV-1, FY 2023 ACD at 61.
5. What Is and Is Not On-Time
The Commission monitors 27 Market Dominant products/categories when it comes to Service Performance. Out of the 27, 12 met their service performance target while 15 failed to meet theirs.
Market Dominant Products Service Performance Results, FY 2023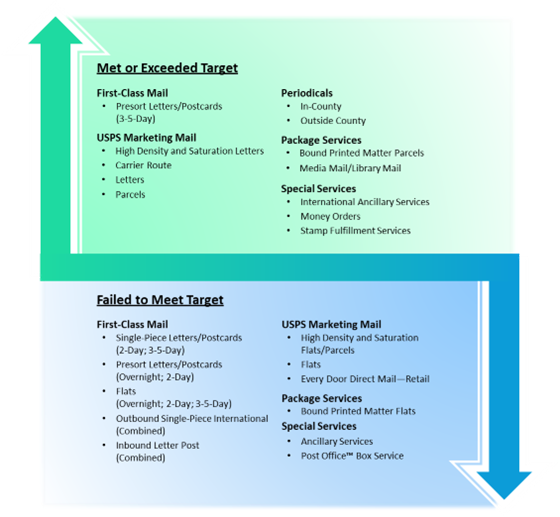
Source: Table V-2, FY 2023 ACD at 92.
6. First-Class Mail USPS Service Performance Dashboard Weekly Data, FY 2022-FY 2023

7. Overall First-Class Mail Service Performance
For First-Class Mail specifically, the Commission analyzed how actual service performance measured up to the annual targets for FY 2023. First-Class Mail is categorized into four groups, Single-Piece Letters/Postcards (SPLC), Presort Letters/Postcards, Flats, and International. The only product to exceed its target was Presort Letters/Postcards with a 3-5 day service standard.
First-Class Mail Service Performance Results, by Percent, FY 2023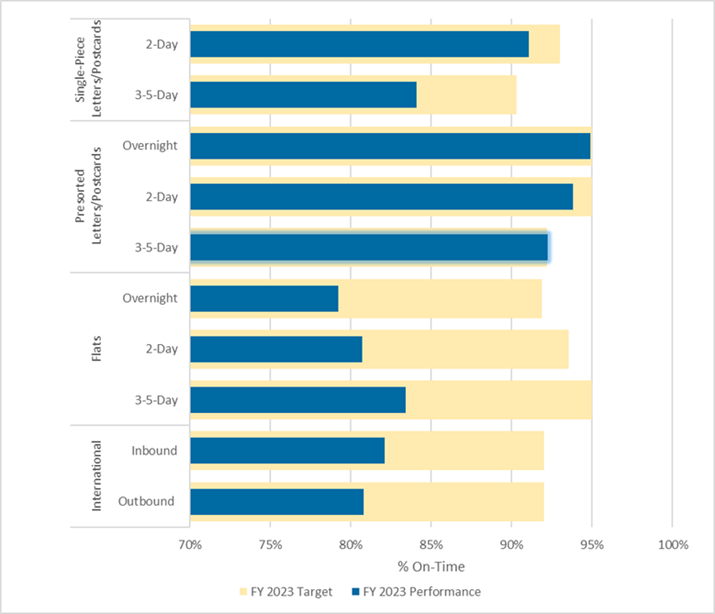
Source: Figure V-13, FY 2023 ACD at 124.
8. Physical Locations
The Postal Service requires physical infrastructure to exist, operate, and interact with their customers. The Commission monitors these numbers to ensure that the Postal Service maintains its ability to provide access to citizens across the United States. There has been a decrease of 129 between FY 2022 and FY 2023.
Number of Retail Facilities, FY 2021 - FY2023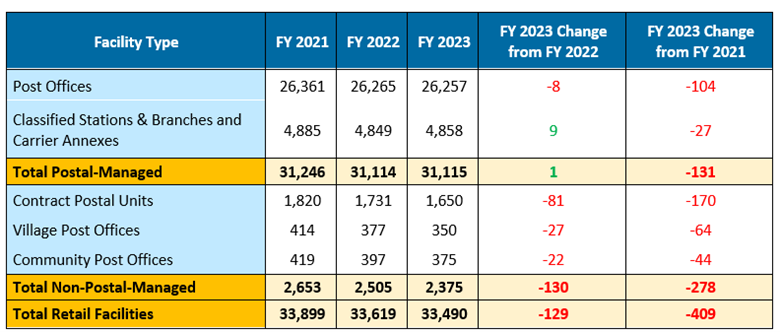
Source: Table V-16, FY 2023 ACD at 182.
9. Post Office Suspensions
The Postal Service uses the suspension process to halt service at offices for a variety of reasons, such as lease issues or debilitating damage from inclement weather. The number of suspended sites has increased between FY 2022 and FY 2023.
Post Office Suspension Activity During FY 2023
Source: Table V-17, FY 2023 ACD at 184.
10. Am I getting Less Mail or Is That Just Me?
The Commission tracks the average volume per delivery point. The Postal Service handled approximately 116 billion pieces of mail in FY 2023 meaning that each delivery point received an average of 697 pieces for the year.
Volume per Delivery Point, FY 2019 – FY 2023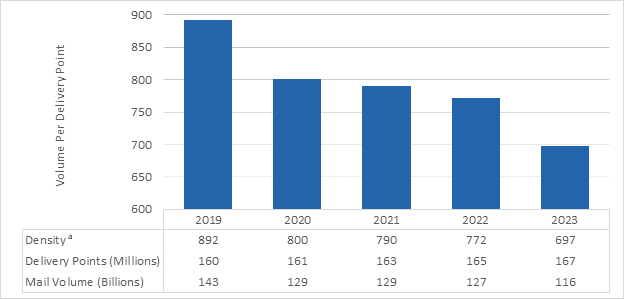
Source: Figure V-37, FY 2023 ACD at 200.
11. "Where Did the Blue Box Go?"
The Commission tracks the number of collection points available to the public, such as the blue boxes seen around city and neighborhood streets. The Postal Service reduced their collection boxes by 477 this year. The decision to add, remove, or relocate comes from the annual density test that is undertaken. In light of falling mail volume, fewer collection boxes are required to service the broader public.
Number of Collection Boxes, FY 2019 – FY 2023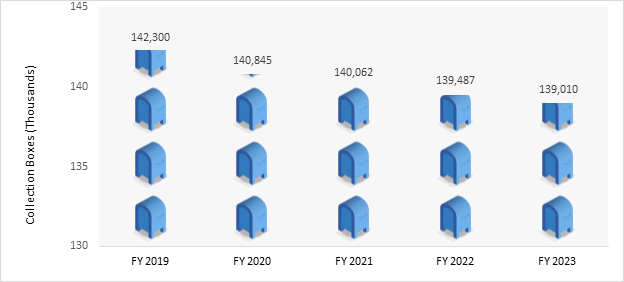
Source: Figure V-38, FY 2023 ACD at 201.
12. Customer Wait Times
The Postal Service reports national average customer wait times for retail service. Between FY 2021 and FY 2022, measures taken by the Postal Service led to an impressive reduction in wait time for customers. However, FY 2023 represents more of a correction and despite seeing a 2 second increase in wait time, the results are still improved relative to both FY 2020 and FY 2021.
National Average Wait Time in Line (in Minutes) by Quarter, FY 2019 – FY 2023

Source: Table V-19, FY 2023 ACD at 203.


