FY 2022 ACD Highlights
Highlights in 10 Charts
The Commission released the FY 2022 Annual Compliance Determination (ACD) on March 29, 2023, reviewing the Postal Service’s compliance with the law, Commission regulations, and its service standards. Here are some of the ACD’s key findings:
1. Getting Your Packages to You
The Postal Service maintains 575 current active domestic contracts with private businesses and other entities to ship items via the USPS’ portfolio of package products. This is a significant decrease from FY 2021, a year in which the Postal Service had 800 active competitive domestic NSAs.
Competitive Domestic NSA Products in Effect During FY 2022
Source: Table IV-1, FY 2022 ACD at 73
2. What Is and Is Not On-Time
The Commission monitors 22 Market Dominant products when it comes to Service Performance. Out of the 22, 11 met their target while 10 failed to meet theirs. The final product, First-Class Mail Single Piece Letters and Cards, split its results, with its 2-day service standard improving to meet its target while its 3–5-day service standard did not. This is an improvement from FY 2021 which saw 16 out of the 22 products fail to meet their respective targets.
Market Dominant Products Service Performance Results, FY 2022
Source: Figure V-1, FY 2022 ACD at 105
3. Overall First-Class Mail Service Performance
For First-Class Mail specifically, the Commission analyzed how actual service performance measured up to the annual targets for FY 2022. In the chart below, SP means Single-Piece, LC means Letters/Postcards, Presorted means Presorted Letters/Postcards, Flats means Flat-Shaped Mail Products, Outbound Int and Inbound Int mean Outbound or Inbound Single-Piece International, respectively. Generally, Letters and Cards met their service standard targets while Flats and International did not.
First-Class Mail
Service Performance Results, by Percent, FY 2022
Source: Figure V-13, FY 2022 ACD at 132
4. Domestic First-Class Mail Service Performance
Taking a closer look at First-Class Mail, the Commission reviewed the quarterly results of FY 2022. The review demonstrated how the Postal Service suffers from the increased volumes of Quarters 1 and 2, which align with the holiday season. The figure below omits Outbound and Inbound International.
Domestic First-Class Mail
Service Performance Results, by Quarter, FY 2022
Source: Figure V-14, FY 2022 ACD at 136
5. Physical Locations
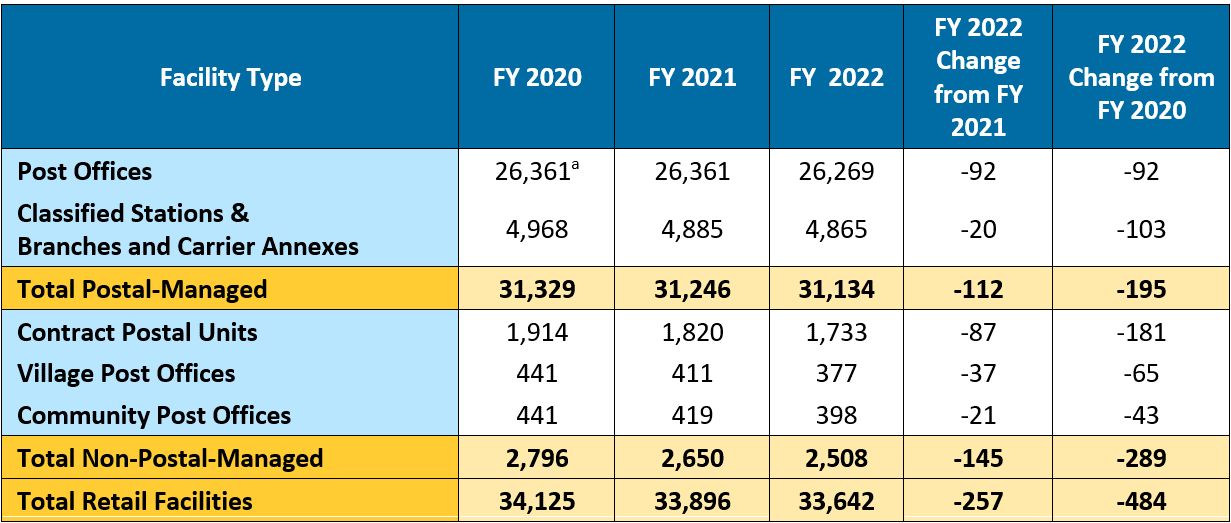
The Postal Service requires physical infrastructure to exist, operate, and interact with their customers. The Commission monitors these numbers to ensure that the Postal Service maintains its ability to provide access to citizens across the United States. There has been a decrease of 257 retail facilities from FY 2021 to FY 2022.
Number of Retail Facilities, FY 2020 – FY 2022
Source: Table V-11, FY 2022 ACD at 177
6. Post Office Suspensions
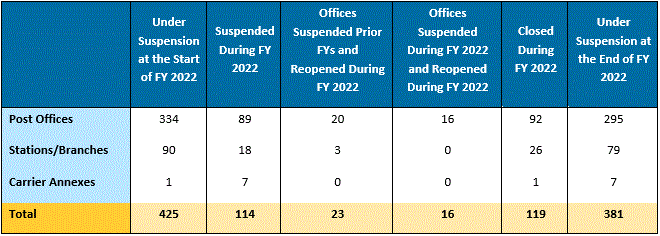
The Postal Service uses the suspension process to halt service at offices for a variety of reasons, such as lease issues or debilitating damage from inclement weather. The number of suspended sites has decreased from FY 2021 to FY 2022, largely due to an ongoing effort by the Postal Service to prioritize this issue.
Post Office Suspension Activity during FY 2022
Source: Table V-12, FY 2022 ACD at 178
7. Staffing
The Postal Service saw a range of employee availability over the past three years. Even though the effects of the COVID-19 pandemic on availability have lessened from FY 2021 to FY 2022, overall availability still marginally decreased due to certain staffing challenges. These challenges greatly impact the employee availability of various functions of the Postal Service, especially mail processing.
Employee Availability, by Month, FY 2020–FY 2022
Source: Figure V-2, FY 2022 ACD at 107
8. Am I Getting Less Mail or Is That Just Me?
The Commission tracks the average volume per delivery point. The Postal Service handled approximately 127 billion pieces of mail in FY 2022 meaning that each delivery point received an average of 772 pieces for the year.
Volume per Delivery Point, FY 2018 – FY 2022
Source: Figure V-28, FY 2022 ACD at 183
9. “Where Did the Blue Box Go?”
The Commission tracks the number of collection points available to the Postal Service, such as the blue boxes seen around city and neighborhood streets.
Number of Collection Boxes, FY 2018 – FY 2022
Source: Figure V-29, FY 2022 ACD at 184
10. Customer Wait Times
The Postal Service reports national average customer wait times for retail service. Numerous measures taken by the Postal Service have led to a reduction in wait time and increase in shipment efficiency for customers from FY 2021 to FY 2022.
National Average Wait Time in Line (in Minutes) by Quarter, FY 2018–FY 2022
Source: Table V-13, FY 2022 ACD at 186


